The Silver Stocks Big Rally Crushed Immediately

Gold’s initial choppy rally in early Globex trading ended minutes after 10 a.m. in Shanghai — and it then chopped sideways until shortly before London opened. It was then forced to chop lower until the COMEX open in New York. Its rally attempt from that point was capped at the 10 a.m. EDT afternoon gold fix in London — and it was then engineered lower in price until minutes before 12 o’clock noon EDT. From there it had a broad and slightly ascending up/down move centered around 2 p.m. in after-hours trading — and ending when the market closed at 5:00 p.m. EDT.
The low and high ticks in gold were recorded by the CME Group as $4,671.00 and $4,760.40 in the June contract…an intraday move of $89.40 an ounce. The June/ August price spread differential in gold at the close in New York yesterday was $35.90…August/October was $33.30 — and October/ December was $35.00 an ounce.
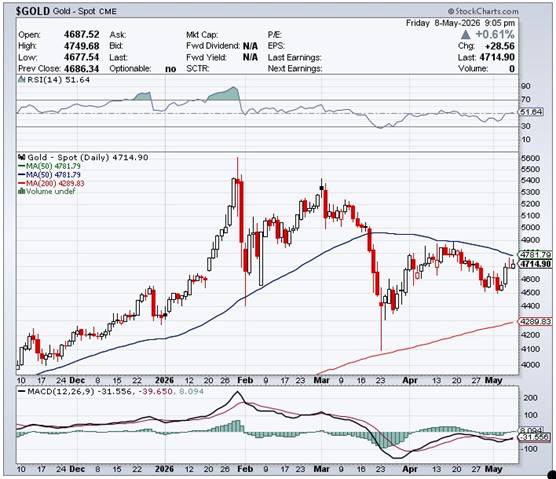
Gold was closed in New York on Friday afternoon at $4,713.70 spot…up $28.10 on the day — and $34.70 off its Kitco-recorded high tick. Net volume was back in fumes & vapours territory at a bit under 88,000 contracts — and there were around 34,300 contracts worth of roll-over/switch volume out of June and into future months.
I saw that 120 gold, plus only 14 silver contracts were traded in May yesterday and, as is always the case, it remains to be seen just how much of these amounts show up in tonight’s Daily Delivery and Preliminary Reports further down in today’s column.
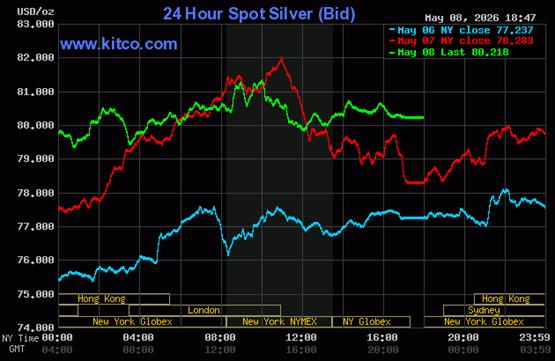
The silver price struggled higher throughout most of the Globex trading session overseas on Friday — and that also ended at the 10 a.m. EST afternoon gold fix in London — and from that point onwards, ‘da boyz’ managed its price path in a similar fashion as gold’s for the rest of the Friday trading session in New York.
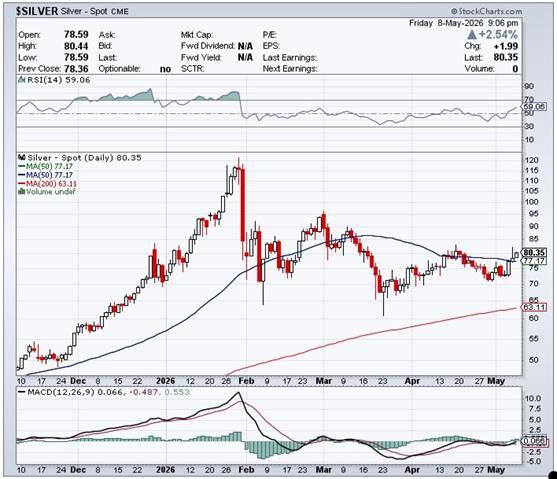
The low and high ticks in it were reported as $78.58 and $82.16 in the July contract…an intraday move of $3.58 an ounce. The May/July price spread differential in silver at the close in New York yesterday was 47.0 cents…July/ September was 58.5 cents — and September/December was 84.3 cents an ounce.
Silver was closed on Friday afternoon in New York at $80.22 spot…up $1.94 on the day — and $1.22 off its Kitco-recorded high tick. Net volume was very much on the lighter side at around 30,700 contracts — and there were around 7,600 contracts worth of roll-over/switch volume in this precious metal.
![]()
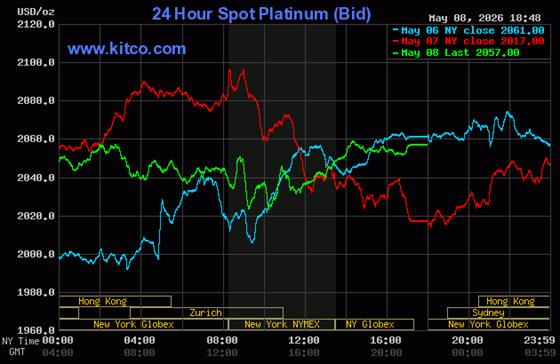
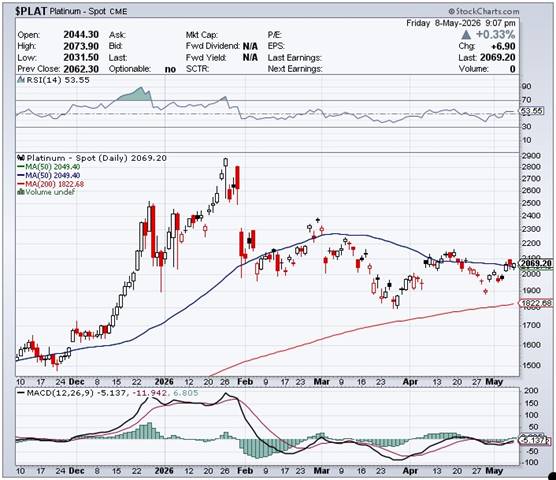
Platinum’s uneven rally in early Globex trading in New York and the Far East, more or less came to ‘grief’ shortly before Zurich opened — and was then sold/ engineered unevenly lower until the 10 a.m. EDT afternoon gold fix in London. Its ensuing and rather anemic rally ended around 2:20 p.m. in after-hours trading — and it didn’t do much after that. Platinum was closed at $2,057 spot…up 40 bucks on the day — and only 3 dollars off its Kitco-recorded high tick.
![]()
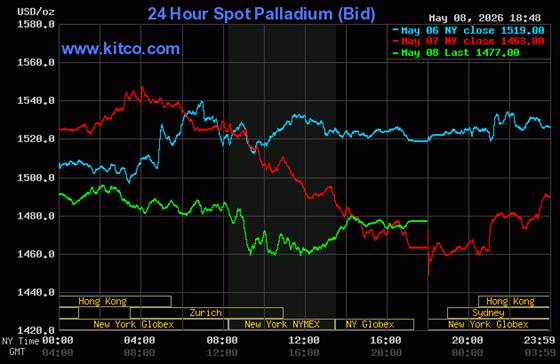
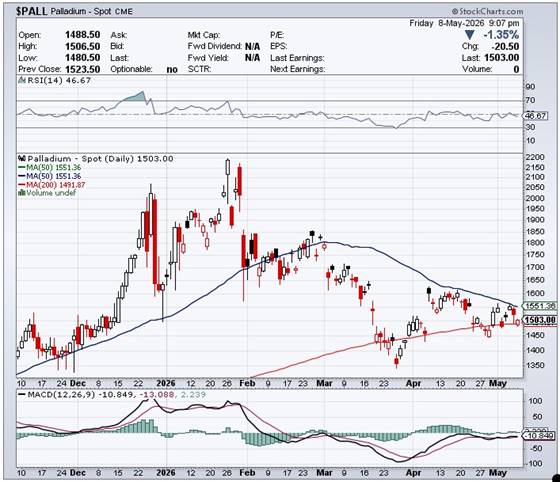
It was more or less the same in palladium, except its New York low in COMEX trading was set shortly after 9 a.m. — and it also struggled higher until shortly after 2 p.m. in the very thinly-traded after-hours market. It didn’t do much after that, either. Palladium was closed at $1,477 spot…up 14 dollars from Thursday — and 21 bucks off its Kitco-recorded high tick.
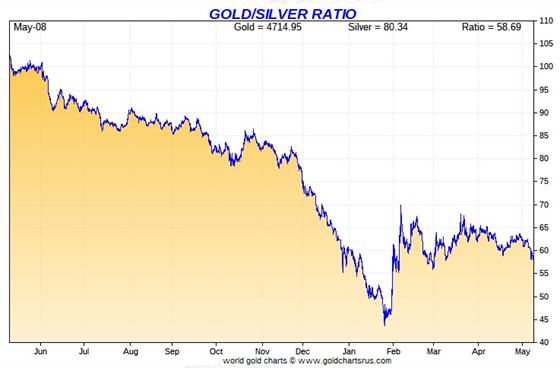
Based on the kitco.com spot closing prices in silver and gold posted above… the gold/silver ratio worked out to 58.8 to 1 on Friday…compared to 59.9 to 1 on Thursday.
Here’s the 1-year Gold/Silver Ratio chart from Nick Laird — and updated with this past week’s data. Click to enlarge.
![]()
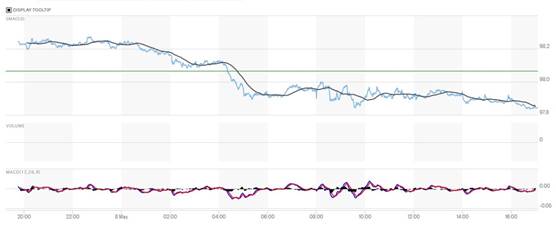
The dollar index was marked-to-close on Thursday afternoon in New York at 98.07 — and then opened higher by about 17 basis points once trading commenced at 7:45 p.m. EDT on Thursday evening…which was 7:45 p.m. China Standard Time on their Friday morning. It then took two steps lower starting around 12:35 p.m. CST — and ending at 10 a.m. in London. From that juncture it chopped/wandered quietly sideways until it began to sag anew starting around 2 p.m. — and that continued until very shortly before the market closed at 5:00 p.m. EDT.
The dollar index finished the Friday trading session in New York at 97.90…down 17 basis points from its close on Thursday.
Here’s the DXY chart for Friday…thanks to marketwatch.com as usual. Click to enlarge.
![]()
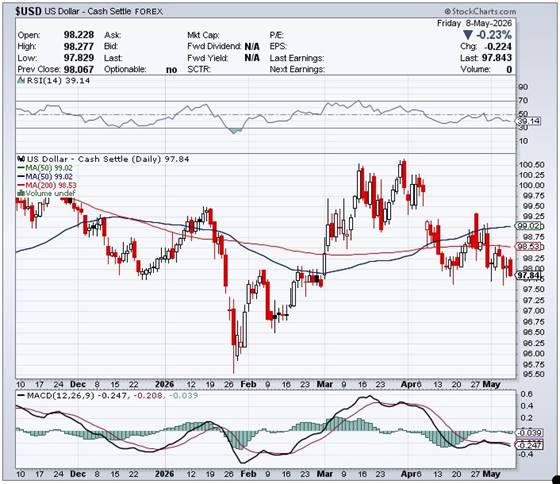
Here’s the 6-month U.S. dollar index chart…courtesy of stockcharts.com as usual. The delta between its close…97.84…and the close on DXY chart above, was 6 basis points below that. Click to enlarge.
![]()
It was another day where ‘da boyz’ wouldn’t allow precious metal prices to fully reflect the continuing decline in the U.S. dollar.
U.S. 10-year Treasury: 4.3640%…down 0.0280/(-0.64%)…as of the 1:59:54 p.m. CDT close.
The ten-year yield traded as high as 4.3880% at the open yesterday — and then the Fed stepped in — and that was that.
For the week, the U.S. ten-year treasury was lower by 1.4 basis points from its close last Friday. Its yield was headed for the moon and stars this past Monday …as high as 4.46% — and the Fed spent the rest of the week working its magic…beating it lower by about ten basis points in four business days.
Here’s the 5-year 10-year U.S. Treasury chart from the yahoo.com Internet site — which puts the current yield into a somewhat longer-term perspective. Click to enlarge.
As I keep pointing out in this spot every Saturday, the 10-year hasn’t been allowed to trade above its 4.92% high set back on October 15, 2023…but it’s now more than obvious that we’ve seen the 3.9482% low for this cycle…which was set back on October 22, 2025. The Fed continues to fight rising bond yields tooth and nail — and that was blatantly obvious this past week as well.
![]()
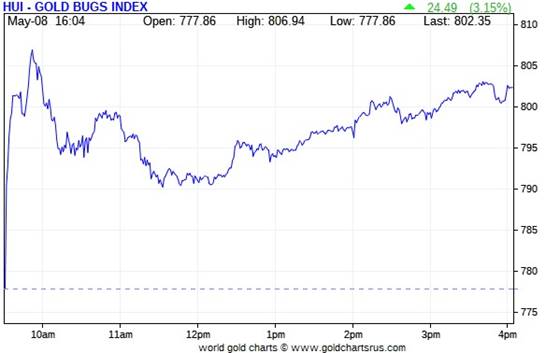
The gold stocks took off higher as soon as the equity markets opened in New York at 9:30 a.m. on Friday morning — and ran into willing sellers about ten or so minutes before gold’s high tick of the day was printed at the 10 a.m. EDT afternoon gold fix in London. They were then sold lower until 11:30 a.m. — and then crawled quietly and tad unevenly higher until trading ended at 4:00 p.m. The HUI closed higher by an impressive 3.15 percent.
![]()
The silver shares were up about 10.5% by 9:50 a.m. in New York…but then a wave of selling appeared, even before silver’s high tick of the day was in — and their respective lows were set around 11:55 a.m. EDT. Then, like the gold equities, they crept quietly and a tad unevenly higher until the markets closed at 4:00 p.m. Despite the fact that silver far outperformed gold on a percentage basis once again, Nick Laird’s Silver Sentiment Index was only allowed to close up 2.02 percent. Click to enlarge.
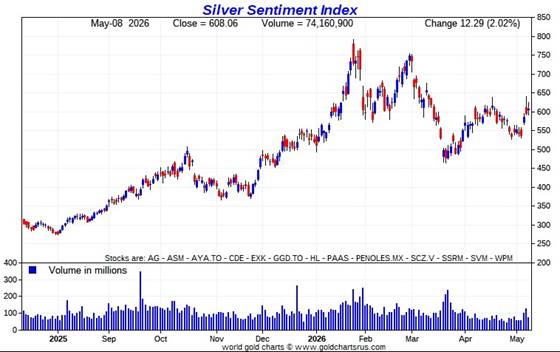
![]()
The star yesterday was Wheaton Precious Precious Metals…as it closed higher by 5.54 percent on this news. The two biggest underperformers were Endeavour Silver and Peñoles…as they actually closed down on the day by 1.18 and 0.85 percent respectively.
Except for the news on WPM above, I didn’t see any other news on any of the other twelve mining companies that comprise the above index.
It was another day where not only did the gold shares outperform the silver stocks on a relative basis…but on an absolute basis as well — and that’s despite the fact that, once again, silver’s gain vastly exceeded gold’s on a percentage basis.
Silver closed up 2.47% on Friday — the Silver Sentiment Index was higher by only 2.02% — and Sprott’s PSLV finished the day up 2.46%
Gold closed higher by 0.60%…the HUI closed up a hefty 3.15% — and Sprott’s PHYS closed higher by 0.56%
After being up about 10.5% percent in the first twenty minutes of the New York trading session yesterday, I’m sure you’ll forgive me one more time for thinking that ‘da boyz’ were actively selling silver shares again yesterday.
The Shanghai/U.S. price premium in silver was back up to 13.95 percent on Friday.
The reddit.com/Wallstreetsilver website, now under ‘new’ and somewhat improved management, is linked here. The link to two other silver forums are here — and here.
![]()
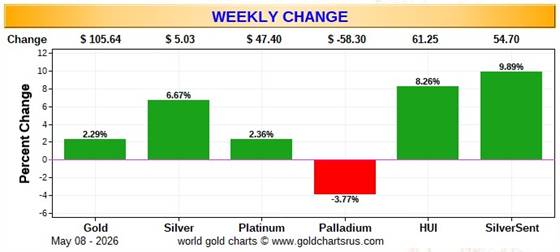
Here the usual three charts that appear in this spot in every weekend missive. They show the changes in gold, silver, platinum and palladium in both percent and dollar and cents terms, as of their Friday closes in New York — along with the changes in the HUI and the Silver Sentiment Index.
Here’s the weekly chart — and with the exception of palladium, it’s green across the board. Although the silver equities have outperformed the gold shares on an absolute basis…it’s no contest at all on a relative basis, as the gold stocks are vastly outperforming the silver shares. As I keep going on about, the silver stocks are being actively suppressed. Click to enlarge.
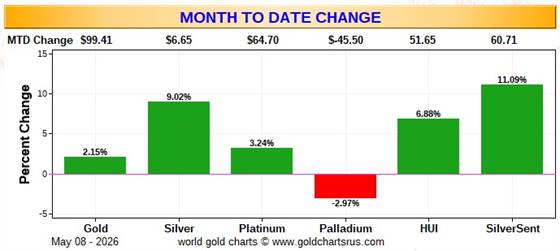
Here’s the month-to-date chart…which is the data from the weekly chart above…plus 1 day…last Friday, May 1. With only one extra day of data, there’s not much difference between it and the weekly chart above. Click to enlarge.
Here’s the year-to-date chart — and ‘da boyz’ have palladium down year-to-date as well. The standout feature is the continuing underperformance of the precious metal shares…which now includes the gold stocks too…as the price suppression in them was particular ruthless in Q1/2026. However, it’s been ruthless in the silver equities since the middle of last September. Click to enlarge.
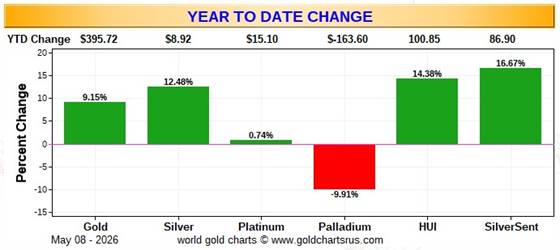
Despite the fact that silver has now broken the $120 barrier…albeit briefly — and the silver well in London came close to running dry last October…the gold/silver ratio remains at a farcical 58.8 to 1 as of Friday’s close. The ‘normal’ and historical ratio is around 15 to 1…which would put silver at around $315 based on gold’s closing price on Friday. And if priced at the ratio of 7:1 that it comes out of the ground at, compared to gold…that would put silver at around $675 an ounce. So a rather impressive triple-digit silver price is in our future…most likely somewhere between those two numbers.
As I say in this spot every Saturday…all that remains to be resolved is what that price will be — and how soon ‘da boyz’ allow it to happen. Its first attempt to reach one of these values back at the end of January was obviously crushed …as were all the rest since then…including the one yesterday. But in the face of the continuing structural deficit in silver — and all the other stuff going on in the world today, they can’t keep it up forever.
![]()
The CME Daily Delivery Report for Day 8 of May deliveries showed that 72 gold…but only 6 silver contracts were posted for delivery within the COMEX-approved depositories on Tuesday.
In gold, the two short/issuers were British bank Barclays and JPMorgan… issuing 50 and 22 contracts out of their respective client accounts. The only three long/ stoppers of the five in total that mattered were French bank BNP Paribas, JPMorgan and Deutsche Bank…picking up 33, 25 and 11 contracts respectively…Deutsche Bank for their house account.
In silver, the only short/issuer that mattered was Marex Spectron, issuing 5 contracts out of its client account. There were four long/stoppers in total… stopping 1 or 2 contracts each, which I shan’t bother to itemize.
In platinum, there were 48 contracts issued and stopped.
In copper, a further 272 contracts/6.800 million pounds were issued and stopped.
The link to yesterday’s Issuers and Stoppers Report is here.
Month-to-date their have been 3,754 gold contracts issued and stopped — and that number in silver is 5,013. The May delivery month is unfolding at a slower pace than any month we’ve had so far this year…silver in particular. At this point in every other delivery month in 2026 so far, deliveries would already be far in excess of what was posted for delivery on First Day Notice as mentioned in the next paragraph.
On First Day Notice for May deliveries, there were 3,937 gold contracts still open — and in silver, that number was 6,299 COMEX contracts.
The CME Preliminary Report for the Friday trading session showed that gold open interest in May declined by 156 COMEX contracts, leaving 775 still open…minus the 72 contracts out for delivery on Tuesday as per the above Daily Delivery Report. Thursday’s Daily Delivery Report showed that 219 gold contracts were actually posted for delivery on Monday…so that means that 219-156=63 more gold contracts were added to May deliveries.
Silver o.i. in May dropped by 2 contracts, leaving 964 still around…minus the 6 contracts out for delivery on Tuesday as mentioned a bunch of paragraphs ago. Thursday’s Daily Delivery Report showed that 9 silver contracts were actually posted for delivery on Monday…so that means that 9-2=7 more silver contracts were added to the May delivery month.
Total gold open interest in the Preliminary Report on Friday night increased by 5,168 contracts — and total silver o.i. rose by only 503 COMEX contracts.
[I checked the final change in total open interest for gold on Thursday — and it showed the hoped-for decent decline…from +9,525 COMEX contracts, down to +2,262 contracts. The final change in total silver o.i. for Thursday showed an inconsequential decline…from +313 contracts, down to +287 COMEX contracts.]
Gold open interest inJune in Friday morning’s final report from the CME Group fell by 9,930 contracts, leaving 243,426 still open — but silver o.i. June rose by a further 45 contracts, leaving 2,503 still around.
![]()
There were a net 16,482 troy ounces of gold added to GLD…but a further 995,507 troy ounces of silver were withdrawn from SLV. An insignificant 539 troy ounces of gold were taken out of GLDM.
The SLV borrow rate started the Friday session at 0.33% — and also ended at 0.33%…with 10.0 million shares available. The GLD borrow rate began the day at 0.36% — and finished it at 0.37%…with 5.5 million shares available.
In other gold and silver ETFs and mutual funds on Earth on Friday… net of any changes in COMEX, GLD, GLDM and SLV activity, there were a net 25,266 troy ounces of gold removed…but a net 785,850 troy ounces of silver were added…mostly because of the 702,463 troy ounces that showed up in iShares/SSLN.
![]()
There was no activity in gold at all over at the COMEX-approved depositories on the U.S. east coast on Thursday…nothing received, nothing shipped out — and no paper activity, either. The link to all those zeros is here.
But it was far busier in silver, as it usually is. There was one truckload/ 600,521 troy ounces received over at Loomis International — and 1,042,159 troy ounces were shipped out.
The two largest ‘out’ amounts were the 633,488 and 381,652 troy ounces that left CNT and Brink’s, Inc. respectively.
There was no paper activity — and the link to Thursday’s COMEX silver action is here.
The Shanghai Futures Exchange updated their silver inventories as of the close of business on their Friday — and it showed that a net and further 788,053 troy ounces/ 24.511 metric tonnes of silver were added… leaving their silver inventories at 26.120 million troy ounces/812.413 metric tonnes.
Although I don’t have room for the charts in today’s column…the Shanghai Gold Exchange reported their withdrawals for April…102.690 tonnes/ 3.302 million troy ounces of gold…but only 20.100 tonnes/646,235 troy ounces of silver.
![]()
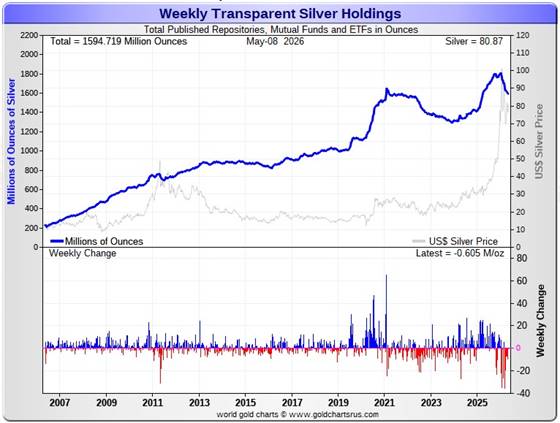
Here are the usual 20-year charts that show up in this space in every weekend column. They show the total amounts of physical gold and silver held in all known depositories, ETFs and mutual funds as of the close of business on Friday. Click to enlarge.
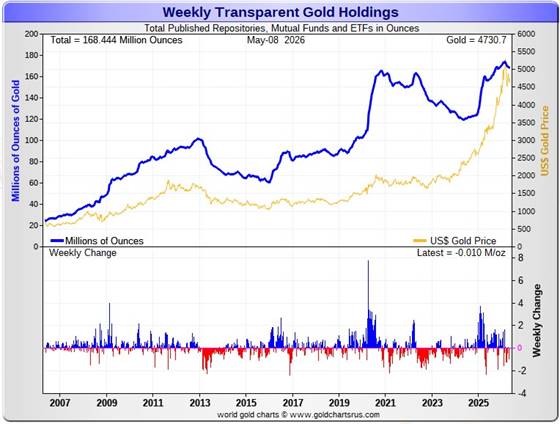
During the business week just past, there were a net 10,000 troy ounces of gold removed — along with a net and further 605,000 troy ounces of silver.
According to Nick Laird’s data on his website, a net 842,500 troy ounces of gold were removed from all the world’s known depositories, mutual funds and ETFs during the last four weeks. The two biggest ‘in’ amounts were the net 317,961 troy ounces that went into Tether…followed by the 168,600 troy ounces that went into five different iShares ETFs. The largest ‘out’ amount by far were the 1.329 million troy ounces that left the COMEX…followed by the 272,500 troy ounces withdrawn from GLD.
The amount of gold in all the world’s ETFs and mutual funds remains barely above its old all-time high of late 2020…see the above chart. But it should be far higher…considering gold’s current price…far more than double it was back then. Why it isn’t, is beyond me.
A net 20.913 million troy ounces of silver were taken out during that same 4-week time period. The largest ‘out’ amounts were the 13.834 million oz. out of the COMEX…followed by the 7.177 million oz. withdrawn from SLV.
The only two ‘in’ amount worth mentioning were the 821,300 troy ounces into iShares/SSLN — and the 698,000 troy ounces into WisdomTree.
It’s been a wild past four or five months in the physical silver space — and the only explanations for these massive withdrawals over that time period was because of redemptions…or the physical metal was needed elsewhere…part of the exodus of precious metals from the west to the east, perhaps.
It should be noted that the amount of silver held in all these depositories, ETFs and mutual funds is now back below its old all-time high inventory level of January 2021. But it should be far higher than it is as well, because silver is about 3x the price it was back then.
Back at its previous inventory peak in late January 2021, silver was around $27 an ounce. Now its about 53 bucks higher. Why the precious metal ETFs aren’t doing better is a mystery for which I have no answer, except for what I mentioned two paragraphs ago.
Retail demand remains very quiet — and there are few ‘out of stock’ signs over at all the retail bullion stores that I follow. They all seem to have decent stocks in just about everything they normally carry. The buy/sell spreads at most bullion stores remain a bit north of 10 percent — and in the case of anything less than 0.999+ pure, it’s far more than that. This obviously means that they have lots of stock — and aren’t overenthusiastic about buying anything.
COMEX silver withdrawals have been monstrous since the start of the year… 135 million in Q1/2026…23 million oz. in April — and 5.5 million oz. so far in May. These amount don’t include the 25 million oz. issued and stopped on the COMEX in the May delivery month so far.
The “rapacious” silver demand will continue until available supplies are depleted — and we’re also well into the sixth year of a structural deficit in silver according to the ongoing reports from The Silver Institute. However, subscriber John Macintosh threw the b.s. flag on their latest report in an essay headlined “The Silver Institute Strikes Again” — and linked once more here.
The vast majority of precious metals being held in these depositories are by those who won’t be selling until the silver price is many multiples of what it is today…if ever.
Sprott’s PSLV is the third largest depository of silver on Planet Earth with 216.8 million troy ounces…unchanged for the last five weeks — and a great distance behind the COMEX, which has now been demoted to the second largest silver depository, where there are 312.3 million troy ounces being held…down a net and further 2.2 million troy ounces this past week…but minus the 103 million troy ounces being held in trust for SLV by JPMorgan.
That 103 million ounce amount brings JPMorgan’s actual silver warehouse stocks down to around the 37 million troy ounce mark…quite a bit different than the 140.3 million they indicate they have — down a net and further 1.4 million troy ounces on the week. They’ve parted with a lot of silver in the last six or so months…around 72 million oz.
But that number doesn’t include the silver that JPMorgan owns and has stored at the other COMEX-approved depositories. They’ve shipped out lots of that over the months and years…especially this year so far — and a lot of it out of CNT.
PSLV remains a very long way behind SLV as well — still the largest silver depository…with 483.8 million troy ounces as of Friday’s close…up a net 200,000 troy ounces from last week.
On a net basis over the last five or so month — and despite the big spike in the silver price at the end of January, just about every depository or ETF has been hemorrhaging silver. However, that outflow has decreased by quite a bit over the last seven weeks.
The latest short report [for positions held at the close of business on Wednesday, April 15 showed that the short position in SLV fell by 11.71%… from the 35.34 million shares sold short in the prior report…down to 31.20 million shares in the latest short report that came out yesterday. This amount represents 5.80 percent of total SLV shares outstanding…still a bit obscene, but not nearly as bad as it was a few months back. Don’t forget that there’s no physical silver backing any of these shorted shares as the SLV prospectus requires.
BlackRock issued a warning more than ten years ago now to all those short SLV, that there might come a time when there wouldn’t be enough metal for them to cover. That would only be true if JPMorgan decides not to supply it to whatever entity requires it. Those that remain short SLV shares are in equally dire straits as those short silver in the COMEX futures market — and I suspect that they’re the same entities.
The next short report…for positions held at the close of trading on Thursday, April 30…will be posted on The Wall Street Journal‘s website this coming Monday, May 11.
Then there’s that other little matter of the monster short position in silver held by Bank of America in the OTC market…with JPMorgan & Friends on the long side. Ted said it hadn’t gone away. He wrote an article about this back in April 2021 headlined “A New Piece of the Puzzle” — and linked here.
In the article, the OCC Report stated that BofA had $8.3 billion in precious metal derivatives at the end of Q4/2020 — but the BofA’s derivatives position is now up to $120.7 billion as of the end of Q4/2025…an almost fifteen-fold increase.
A while after that article came out, he also come to the conclusion that they’re short around 25 million ounces of gold with these same parties as well. Once these short covering rallies in both silver and gold really explode higher…we’ll see if they need to get taken over, like Bear Stearns did back in 2008 — and for the same reason.
![]()
The Commitment of Traders Report, for positions held at the close of COMEX trading on Tuesday, showed the expected small changes in the commercial net short positions in both silver and gold.
In silver, the Commercial net short position increased by a piddling 83 COMEX contracts…415,000 troy ounces of the stuff — and the smallest weekly change that I can remember.
They arrived at that number through the sale of 3,582 long contracts…but also bought back/covered 3,499 short contracts — and it’s the difference between those two numbers that represents their change for the reporting week.
Under the hood in the Disaggregated COT Report it was a bit more interesting …but only just. The Managed Money traders increased their net long position by 237 contracts — and the Nonreportable/small traders did the same… increasing their net long position by 351 contracts. That meant that the Other Reportables had to have reduced their net long position…which they did to the tune of 505 COMEX contracts.
Doing the math: 237 plus 351 minus 505 equals 83 COMEX contracts…the change in the Commercial net short position.
The Commercial net short position in silver now sits at 40,535 COMEX contracts/202.675 million troy ounces of the stuff…up those 83 contracts from last week’s COT Report.
The Big 4 collusive commercial traders decreased their net short position by a tiny amount for the third week in a row…131 COMEX contracts, down to 30,049 COMEX contracts…which is only 230 contracts off their lowest short position on record.
The Big ‘5 through 8’ increased their net short position by 260 COMEX contracts…down to 14,539 COMEX contracts — and only about 1,850 contracts off their lowest short position I have records for.
The Big 8 commercial traders in total are net short 44,588 COMEX silver contracts…up 129 contracts on the week — and only about 1,200 contracts off their lowest short position I have records for.
Ted’s raptors, the 24 small commercial traders other than the Big 8, increased their net long position by an inconsequential 46 COMEX contracts — and are net long silver by 4,053 COMEX contracts.
Here’s the 3-year COT chart for silver thanks to Nick Laird — and updated with the above data. Click to enlarge.
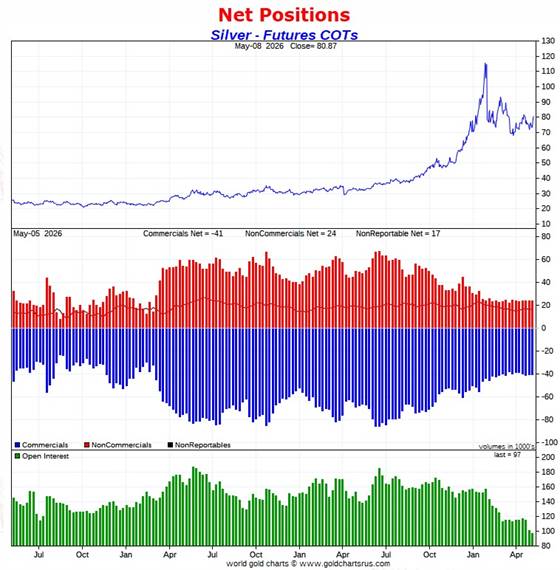
As preordained by the price activity and ultra low trading volume during the reporting week just past…it turned out to be the snoozer of a COT Report for silver I was expecting.
The Big 8 commercial traders are net short 46.0 percent of total open interest in silver in the COMEX futures market…up from the 43.9 percent they were short in last week’s COT Report. The sole reason for that increase was because of a further decline in total silver open interest, which fell by another 4,343 COMEX contracts during the reporting week — and this obviously affects the percentage calculation.
As I’ve been pointing out for many weeks now, total open interest in silver, like it is for gold, is at 17-year low…96,932 contracts as of the COMEX close on Tuesday.
And still nothing has changed in silver from a COMEX futures market perspective, as it remains incandescently white-hot bullish…just waiting for ‘da boyz’ to set it free.
![]()
In gold, the commercial net short position rose by a mostly inconsequential 4,122 COMEX contracts…412,200 troy ounces of the stuff.
They arrived at that number through the sale of 2,323 long contracts — and also sold/went short 1,799 COMEX contracts. It’s the sum of those two numbers that represents their change for the reporting week.
Under the hood in the Disaggregated COT Report the traders in the Managed Money and Nonreportable/small trader categories increased their net long positions…the former by 4,502 and the latter by 390 contracts. The Other Reportables had to be net sellers — and they were…reducing their net long position by 770 COMEX contracts.
Doing the math: 4,502 plus 390 minus 770 equals 4,122 COMEX contracts… the change in the commercial net short position.
The commercial net short position in gold now stands at 199,935 COMEX contracts/19.994 million troy ounces…up those 4,122 contracts from this week’s report.
The Big 4 commercial traders increased their net short position by 1,306 COMEX contracts, up to 124,729 contracts…their lowest short position they’ve held since April 7 of this year — and before that, May 30 of last year.
The Big ‘5 through 8’ commercial traders also increased their net short position…them by 1,652 contracts, up to 44,887 COMEX contracts held net short…which is only about 2,600 contracts above their lowest short position that I have records for.
The Big 8 commercial traders in total are net short 169,616 COMEX contracts…up 2,958 contracts — and only about 4,300 contracts above their lowest short position that I have records for.
But since the commercial net short position rose by 4,122 contracts — and the Big 8 only accounted for 2,958 of those contracts…that meant that Ted’s raptors, the 36 small commercial traders other than the Big 8, had to have been sellers as well during the reporting week — and they were. They increased their net short position by 1,164 contracts — and are now net short by 29,319 COMEX contracts.
And like they currently are in silver, they would normally be net long gold by tens of thousands of contracts at this point in the price cycle — and why they’re not this time around, I have no idea. But if they weren’t short this amount — and net long those tens of thousands of contracts, it’s a guarantee that gold would be many, many thousands of dollars higher in price than it is now.
I suspect that no more than two or three of these small commercial traders hold the vast majority of this short position.
Here’s Nick’s 3-year COT chart for gold — and updated with the above data. Click to enlarge.
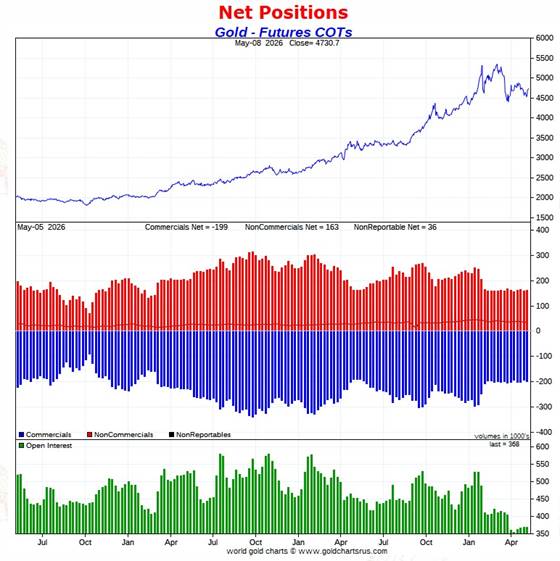
Although I would have been happier if the commercial net short position had fallen by 4,122 COMEX contracts…rather than risen by that amount…in the overall, this smallish increase is of no consequence.
The Big 8 are short 46.1 percent of total open interest in the COMEX futures market…up a bit from the 45.1 from what they were short in last week’s report. Part of that percentage increase was also a result of decrease in total open interest.
However, unlike silver, the commercial net short position in gold is much larger than the Big 8 short position…because the rest of the commercial traders, Ted Butler’s raptors, are also net short gold. Adding them into the mix, which you have to do, puts the commercial net short position in gold at 54.1 percent of total open interest in the COMEX futures market…up from the 52.7% that they were short in last week’s report.
Despite this rather inconsequential increase in the commercial net short position, the set-up in gold from a COMEX futures market perspective is still wildly bullish. Like I’ve been saying for a while now, the commercial traders have run face first into the law of diminishing returns as far as reducing their short position by any consequential amount. Ditto in silver.
All rally attempts in the precious metals lately, including the ones this past week, have been stymied…as have their share prices — and I’m still left wondering what event will be allowed to finally set them off. As I’ve been saying for years, it will only happen when it’s allowed — and not in a news vacuum, either.
![]()
In the other metals, the Managed Money traders in palladium decreased their net short position by 398 COMEX contracts — but remain net short palladium by 1,938 COMEX contracts.
The commercial traders in the Swap Dealers category are net long palladium by 1,657 contracts…up a further 217 contracts on the week. The traders in the Producer/ Merchant category are net short 882 COMEX contracts…a decrease of 10 contracts from last week. The traders in the Other Reportables and Nonreportable/ small trader categories are net long smallish amounts…under a thousand contracts each.
As I keep pointing out about these numbers, palladium is a very dinky market. Total open interest is only 15,985 COMEX contracts…an increase of 191 contracts this reporting week…still the lowest it’s been since mid-2023. Open interest in platinum is also the lowest since that time as well.
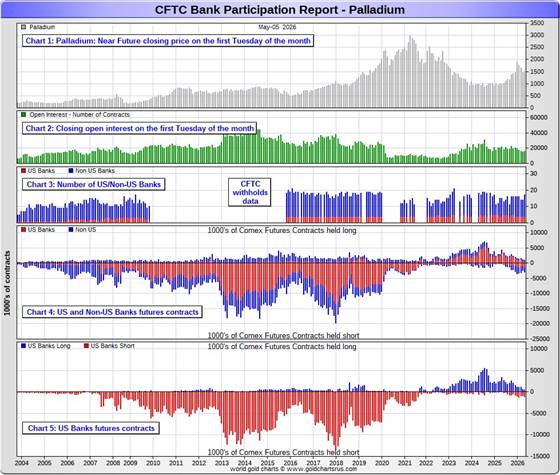
The world’s banks are net short 12.1 percent of total open interest in palladium in the COMEX futures market as of the May Bank Participation Report that came out yesterday…which is an increase from the 8.9 percent that they were net short in April’s Bank Participation Report.
This is a very strange and twisted market once you get a look into its internal structure — and as I point out in every monthly Bank Participation Report, the only reason that there’s a COMEX futures market in palladium is so the collusive commercial traders of whatever stripe can control its price.
In platinum the Managed Money traders decreased their net long position by a further 1,703 COMEX contracts — but remain net long platinum by 12,372 contracts. The traders in the Other Reportables and Nonreportable/ small trader category remain net long platinum by very respectable amounts as well.
The commercial traders in the Producer/Merchant category in platinum are net short 14,264 COMEX contracts, an increase of a tiny 42 contracts from what they were net short last week. The Swap Dealers in the commercial category also decreased their net short position this past week, them by 597 COMEX contracts this past week — and remain net short platinum by 8,387 COMEX contracts.
It’s mostly the world’s banks that are ‘The Big Shorts’ in platinum in the COMEX futures market, as per May’s Bank Participation Report that came out yesterday — and haven’t done much of anything in platinum in the last four months, in aggregate.
In copper, the Managed Money traders increased their net long position by a further 2,536 COMEX contracts during the past reporting week — and are now net long copper by 63,473 contracts…1.587 billion pounds of the stuff. It was their act of adding to their long positions that drove copper prices higher during the reporting week.
Copper, like palladium, continues to be a wildly bifurcated market in the commercial category. The Producer/Merchant category is net short 101,414 copper contracts/ 2.535 billion pounds — while the Swap Dealers are net long 29,397 COMEX contracts/735 million pounds of the stuff.
Whether this dichotomy in copper means anything or not, will only be known in the fullness of time. Ted Butler said it didn’t mean anything as far as he was concerned, as they’re all commercial traders in the commercial category. But this bifurcation has been in place for as many years as I’ve been keeping records — and that’s a very long time.
In this vital industrial commodity, the world’s banks…both U.S. and foreign… are net short copper by 2.4% of total open interest in the May Bank Participation Report. Back in the October 2025 BPR, these same banks were net long 0.90% of the total open interest in copper in the COMEX futures market. So basically they’re market neutral…but only numerically, as that dichotomy between the two groups of commercial traders is still there.
At the moment it’s all the commodity trading houses such as Glencore and Trafigura et al., along with some hedge funds, that are mega net short copper in the Producer/Merchant category, as the Swap Dealers are net long, as pointed out above.
The next Bank Participation Report is due out on Friday, June 5.
![]()
Here’s Nick Laird’s “Days to Cover” chart, updated with the COT data for positions held at the close of COMEX trading on Tuesday, May 5. It shows the days of world production that it would take to cover the short positions of the Big 4 — and Big ‘5 through 8’ traders in every physically traded commodity on the COMEX. This chart is a graphical representation of what’s shown in the COT Report above. Click to enlarge.
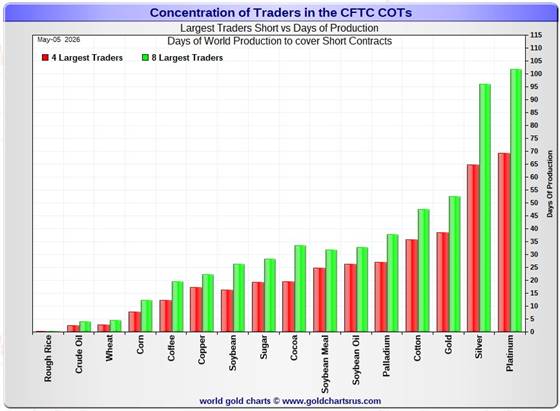
In this week’s data, the Big 4 traders are short about 65 days of world silver production…unchanged from the prior COT report. The ‘5 through 8’ large traders are short an additional 31 days of world silver production …also unchanged from last week’s report…for a total of 96 days that the Big 8 are short…and of course unchanged from that last COT Report.
This lack of change should come as no surprise, considering the fact that Commercial net short position only rose by an irrelevant 83 contracts during the reporting week.
Those 96 days that the Big 8 traders are currently short, represents about 3.2 months of world silver production, or 222.940 million troy ounces/44,588 COMEX contracts. That’s up a tad from the 222.295 million troy ounces/ 44,459 contracts in last Friday’s COT Report.
In gold, the Big 4 are short about 39 days of world gold production…up about 1 day from the prior report — and the Big ‘5 through 8’ are short an additional 13 days of world production…down about 1 day from last week, for a total of 52 days of world gold production held short by the Big 8 commercial traders — and obviously unchanged from last week. This remains about the lowest number of days short for them that I can remember. Like I’ve been saying for several months now…everything is washed out to the downside — and that fact has to show up in these numbers as well, which it does.
In silver, I suspect that a goodly chunk of the short position in the Big 4 traders category is mostly held by only two traders…both of them U.S. banks.
I note that the short position of the Big 8 traders in platinum is now up to 6 days of world production longer than the Big 8 are short in silver. This chart is also a graphical representation of why I consider platinum to be ‘da boyz’ No. 2 problem child after silver.
I also note from this chart that, for the fourth week in a row, cotton has knocked palladium out of the number four spot — and into fifth place.
The short position in SLV now sits at 31.20 million shares/troy ounces as of the latest short report that also came out two weeks ago…for positions held at the close of trading on Wednesday, April 15. This represents a decline of 11.71% from the prior report. This 31.20 million share number, which represents 5.80% of total SLV shares outstanding, is not as off-the-charts grotesque and obscene as it used to be — but realistically should be something less than half that amount.
Don’t forget that there’s not a single solitary troy ounce of silver backing any of these shorted shares as the SLV prospectus requires.
The short position in GLD is 9.94 million shares…2.71% of total GLD shares outstanding — and is of little concern.
The next short report…for positions held at the close of business on Wednesday, April 30…is due out this coming Monday…May 11.
In the overall in yesterday’s COT Report, the short positions of the Big 8 commercial traders in silver increased by an inconsequential amount — and the set-up in it remains beyond wildly bullish. In gold, the Big 8 increased their short position by a smallish amount. The set-up in it remains exceedingly bullish as well, but not quite to the same degree that it is in silver.
As Ted Butler pointed out quite often over the years, the resolution of the Big 4/8 short positions will be the sole determinant of precious metal prices going forward…although that short position in gold held by his raptors continues to be a negative factor — and it did increase by a bit this reporting week.
And as he also pointed out over the years, there would come a time when what the numbers show in the COT Report won’t matter, as events in the real world…whatever they may be…will overtake them. That hasn’t happened yet…but that day is coming.
All that we await now, is the denouement that follows. The big bear raids we’ve endured over the last several months, weeks and days…are all part and parcel of the process to keep their prices in line until that moment arrives.
![]()
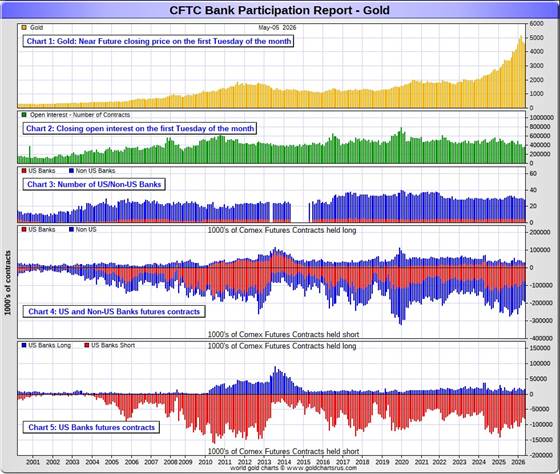
The May Bank Participation Report [BPR] data is extracted directly from yesterday’s Commitment of Traders Report. It shows the number of futures contracts, both long and short, that are held by all the U.S. and non-U.S. banks as of Tuesday’s cut-off in all COMEX-traded products.
For this one day a month we get to see what the world’s banks have been up to in the precious metals. They’re usually up to quite a bit — but didn’t do much this past month, as I pointed in The Wrap in yesterday’s missive.
[The May Bank Participation Report covers the four-week time period from April 7…to May 5 inclusive]
In gold, 5 U.S. banks are net short 63,678 COMEX contracts, up an inconsequential 2,082 contracts from the 61,596 contracts that these same 5 U.S. banks were net short in the April BPR. This remains their lowest short position since April 2024.
Also in gold, 23 non-U.S. banks are net short 95,971 COMEX contracts, up, 2,530 contracts from the 93,441 contracts that 24 non-U.S. banks were net short in April’s BPR.
At the low back in the August 2018 BPR…these non-U.S. banks held a net short position in gold of only 1,960 contacts — so they’ve been back on the short side in a gargantuan way ever since. Only a handful of these banks hold meaningful short positions in gold. The short positions of the rest are of no consequence — and never have been.
Although most of the largest U.S. and foreign bullion banks are in the Big 8 short category, some of the hedge fund/commodity trading houses are short large amounts of gold in that category as well. There’s also the possibility that the BIS could be short gold in the COMEX futures market.
As of May’s Bank Participation Report, 28 banks [both U.S. and foreign] were net short 43.4 percent of the entire open interest in gold in the COMEX futures market…down from the 43.7 percent that 29 banks were net short in the April BPR.
And if you remember from the above COT Report, the commercial net short position in gold was 54.1 percent of total open interest — and if you subtract out the 43.4 percent held short by the banks…only 54.1 minus 43.4=10.7 percentage points of the commercial net short position are not held by the banks.
Here’s Nick’s BPR chart for gold going back to 2000. Charts #4 and #5 are the key ones here. Note the blow-out in the short positions of the non-U.S. banks [the blue bars in chart #4] when Scotiabank’s COMEX short position was outed by the CFTC in October of 2012. Click to enlarge.
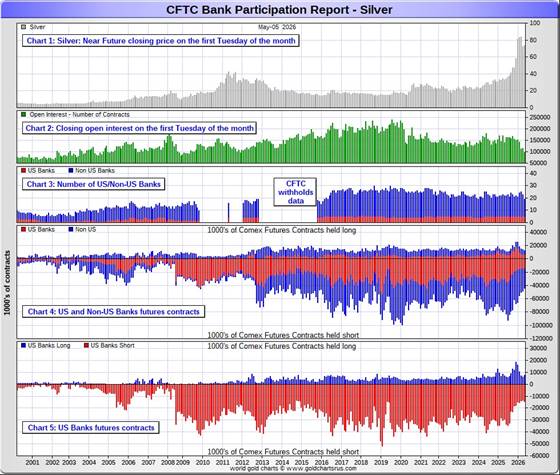
In silver, 5 U.S. banks are net short 6,929 COMEX contracts…down 427 contracts from the 7,356 contracts they were net short in the April BPR.
But the number I really wanted to see was the change in their gross short position. In the December BPR it was 17,838 contracts, in January’s it was 15,099 contracts, in February’s it was 15,414, in March’s, it was down to 14,048 contracts — and in April it was 13,427 COMEX contracts. However, in yesterday’s report, that number jumped up to 14,558 contracts.
The five U.S. banks that are net short silver would be Citigroup, Wells Fargo, Bank of America, Goldman Sachs — and Morgan Stanley…with by far the lion’s share held by no more than two of these banks…most likely BofA and Wells Fargo.
Also in silver, 14 non-U.S. banks are net short 24,520 COMEX contracts, down a further 2,556 contracts from the 27,076 contracts that 18 non-U.S. banks were net short in the April BPR. This is their smallest net short position since February 2024.
It’s a given, based on silver deliveries in 2025 — and so far in 2026…that HSBC, Barclays, Standard Chartered, BNP Paribas, Deutsche Bank and Macquarie Futures hold by far the lion’s share of the short positions of these non-U.S. banks. Canada’s Bank of Montreal is a card-carrying member of this group as well.
And, like in gold, the BIS could also be actively shorting silver. However, the remaining short positions divided up between the rest of the small handful of non-U.S. banks, are immaterial — and have always been so….the same as most of the 20-odd non-U.S. banks in gold as well.
As of May’s Bank Participation Report, 19 banks [both U.S. and foreign] were net short 32.5 percent of the entire open interest in silver in the COMEX futures market — up from the 29.9 percent that 23 banks were net short in the April BPR. The reason for that big percentage jump is the implosion of total silver open interest over the last month…which affects the percentage calculation.
Here’s the BPR chart for silver. Note in Chart #4 the blow-out in the non-U.S. bank short position [blue bars] in October of 2012 when Scotiabank was brought in from the cold. Also note August 2008 when JPMorgan took over the silver short position of Bear Stearns—the red bars. It’s very noticeable in Chart #4—and really stands out like the proverbial sore thumb it is in chart #5. Click to enlarge.
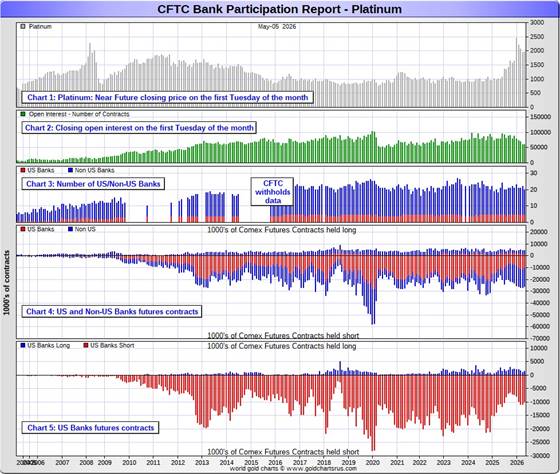
In platinum, 5 U.S. banks are net short 8,547 COMEX contracts in the May BPR, down 1,226 contracts from the 9,773 contracts that these same 5 U.S. banks were short in the April BPR. This is the first month of the last eight that these U.S. banks have reduced their short position in platinum.
At the ‘low’ back in September of 2018, these U.S. banks were actually net long the platinum market by 2,573 contracts…so they still have a lot more work to do to get back to market neutral…if they ever intend to.
Also in platinum, 15 non-U.S. banks increased their net short position by 466 contracts… from 12,556 contracts held by 17 banks in April’s BPR…up to 13,022 contracts in the May BPR. This is 5.33x the amount they held short in the May/25 BPR, so they’ve been gone back on the short side in platinum by a huge amount since then.
Back in the December 2023 BPR, these non-U.S. banks were net short a microscopic 35 platinum contracts…so they have yeoman work to do if they ever want to get back to even close to that number. I doubt that they’ll ever accomplish that — and are permanently stuck with this short position.
As you know, platinum remains the big commercial shorts No. 2 problem child after silver — and there’s now a long-term structural deficit in it [and palladium] as well.
As of May’s Bank Participation Report, 20 banks [both U.S. and foreign] were net short 35.6 percent of platinum’s total open interest in the COMEX futures market, down from the 37.3 percent that 22 banks were net short in April’s BPR — and down in part because of the increase in total open interest.
Here’s the Bank Participation Report chart for platinum. Click to enlarge.
In palladium, 4 U.S. banks are net short 783 COMEX contracts in the May BPR, an increase of 361 contracts from April.
Also in palladium, 13 non-U.S. banks are net short by 1,161 COMEX contracts …an increase of 218 contracts from the 943 contracts that 10 non-U.S. banks were net short in the April BPR.
None of this mean anything considering how tiny these amounts are… especially when divided up between 17 banks.
And as I’ve been commenting on for almost forever, the COMEX futures market in palladium is a market in name only, because it’s so illiquid and thinly-traded. Its total open interest in yesterday’s COT Report was only 15,985 contracts…compared to 60,646 contracts of total open interest in platinum…96,932 contracts in silver — and 367,932 COMEX contracts in gold.
Total open interest in palladium has increased quite a bit over the last ten years, because I remember when it was less than 9,000 contracts on average. So it’s nowhere near as illiquid as it used to be — and it’s also been helped along by the fact that the bid/ask is now down to only 40 bucks. It used to be $150 at one point way back when.
As I say in this spot every month, the only reason that there’s a futures market at all in palladium, is so that the Big 8 commercial traders can control its price. That’s all there is, there ain’t no more.
As of this Bank Participation Report, 17 banks [both U.S. and foreign] are net short 12.1 percent of total open interest in palladium in the COMEX futures market…up from the 8.9 percent of total open interest that 14 banks were net short in the April BPR.
For the last 5 years or so, the world’s banks have not been involved in the palladium market in a material way…see its chart below. Even with all the world’s banks back on the short side by a bit now…it’s almost all hedge funds and commodity trading houses on the short side.
The Big 8 shorts, none of which are banks, are net short 41.1 percent of total open interest in palladium as of yesterday’s COT Report…down from the 45.1 percent of total open interest they were a month ago.
Here’s the palladium BPR chart — and it remains to be seen if they return as big short sellers again at some point like they’ve done in the past. Click to enlarge.
Excluding palladium, most likely no more than a dozen or so in total — and mostly U.S. and U.K.-based…along with French bank BNP Paribas and Deutsche Bank…continue to hold meaningful short positions in the other three precious metals…although I won’t let Canada’s Bank of Montreal or Australia’s Macquarie Futures off the hook just yet.
As I pointed out above, some of the world’s commodity trading houses and hedge funds are also net short the four precious metals…far more short than the banks in some cases. They have the ability to affect prices if they choose to exercise it. But it’s still the collusive Anglo/American/Western bullion bank cartel in the commercial category that are at Ground Zero of the price management scheme in the COMEX futures market.
And as has been the case for several decades now, the short positions held by the Big 4/8 traders is the only thing that matters…especially the short positions of the Big 4…or maybe only the Big 1 or 2 in silver. How this is ultimately resolved [as Ted kept pointing out] will be the sole determinant of precious metal prices going forward.
Considering the current state of affairs of the world as they stand today — and the structural deficit in silver — and now in platinum and palladium as well, the chance that these big bullion banks and commodity trading houses could get overrun at some point, is no longer zero — and certainly within the realm of possibility if things go totally non-linear somewhere.
But…as Ted kept reminding us…if they do finally get overrun, it will be for the very first time. And it was patently obvious that the collusive commercial traders of whatever stripe had to step in multiple times over the last four months in order to prevent exactly that from happening. If they hadn’t, Ted Butler’s “Bonfire of the Silver Shorts” would have become a reality within days…if not hours.
The next Bank Participation Report for trading in April is due out on Friday, June 5.
![]()
CRITICAL READS
U.S. Jobs Jump 115K, Smashing Estimates; Unemployment Rate Unchanged At 4.3%
In his preview of today’s NFP report, Goldman’s Delta One head wrote that “NFP almost feels like a sideshow at this point. You can argue weak labor data gives a Warsh led Fed enough cover to cut, but with oil and input inflation still elevated there’s also an argument that a weakening labor market alongside a constrained Fed is actually the more difficult combination for risk assets.” With that in mind, moments ago the BLS reported that in April the U.S. added a red hot 115K, above the median consensus of 65K (and near the upper end of the forecast range which peaked at 133K), down from an upward revised (for once) 185K (originally 178K). This was the first back to back gain in jobs in a year.
The change in February jobs was revised down by 23,000, from -133,000 to -156,000, and the change for March was revised up by 7,000, from +178,000 to +185,000. With these revisions, employment in February and March combined is 16,000 lower than previously reported.
A look below the surface reveals a less impressive picture: while payrolls rose to a new record high, actual employment has dropped to the lowest since January 2025…
… as the monthly change in payrolls has disconnected dramatically from actual jobs, which dropped by 226K in April and are now down 4 months in a row!
Also worth noting: while it’s seasonal, in April the US saw 391K jobs added only in spreadsheets thanks to a surge in Birth/Death model adjustments, the highest since October, and clearly a revision of the previous trend of revising birth death adjustments lower.
The unemployment rate was unchanged at 4.3%, in line with expectations, which is odd since all major ethnic groups saw their unemployment rate increase…
In short, this was a much uglier jobs report than the clearly “nudged” headline indicates, although we doubt that anyone in the market will notice when all that matters if whether memory stocks today have momentum or not.
This long and multi-chart Zero Hedge article was posted on their website at 9:25 a.m. EDT on Friday morning — and another link to it is here. A directly related and follow-on ZH article from 12:22 p.m. EDT is headlined “Closer Look Reveals April Jobs Report Was a Disaster, and AI is Now Here to Take Your Job” — and linked here.
![]()
Car payments squeeze Americans as auto debt hits $1.68 trillion, report finds
Auto debt is becoming a bigger problem for consumers, a new report shows.
Total auto debt reached $1.68 trillion at the end of 2025 — a 37% increase since late 2018, when the debt was at $1.23 trillion, according to a new analysis by The Century Foundation, a left-leaning think tank, and Protect Borrowers, a consumer advocacy group, provided exclusively to CNBC. That figure includes traditional installment loans and leases.
Nearly 86 million Americans — about 1 in 4 — carry outstanding auto loan or lease debt, the organizations calculated.
The average origination balance for an auto loan was $33,519 at the end of 2025, compared with $24,782 in the fourth quarter of 2018, the research shows. Over that same period, the typical monthly auto loan payment increased to more than $680 from $506.
“People are seeing more and more of their paychecks eaten by their car payments,” said Angela Hanks, chief of policy programs at The Century Foundation.
This CNBC news item appeared on their website on Wednesday — and I thank Swedish reader Patrik Ekdahl for sharing it with us. Another link to it is here.
![]()
‘Not a Chance Hormuz Opens’: How Wall Street’s new NACHO trade bets on a prolonged oil shock
Move over TACO trade. Traders now have a new acronym for a market increasingly skeptical that the Strait of Hormuz crisis will end anytime soon: NACHO.
The shorthand “Not A Chance Hormuz Opens” has emerged on trading desks and among market commentators to describe growing skepticism that repeated remarks by U.S. President Donald Trump about reopening the key shipping route will lead to a swift resolution.
“It’s essentially the market losing hope in the chance of a quick fix,” eToro market analyst Zavier Wong told CNBC.
“For most of this crisis, every ceasefire headline triggered a sharp selloff in oil, and traders kept pricing in a resolution that never came. NACHO is an acknowledgment that higher oil isn’t a temporary shock to trade around, it’s the current market environment.”
As recently as Thursday, the U.S. and Iran exchanged fire in the Strait of Hormuz, with both sides accusing the other of starting the confrontation.
The renewed hostilities further imperil the two countries’ ceasefire agreement, which had already been strained by repeated accusations of violations.
Another CNBC story from Patrik Ekdahl. This one showed up on their Internet site at 1:38 a.m. EDT on Friday morning — and another link to it is here.
![]()
Japan to keep intervening to defend 160-per-dollar level, ex-BoJ official says
Japan likely intervened during the Golden Week holidays and will step back into the market if the yen renews its slide below the psychologically key 160-per-dollar level, Atsushi Takeuchi, a former central bank official who took part in Tokyo’s market forays a decade ago, told Reuters.
While the Ministry of Finance has no intention of defending a certain line in the sand, it likely intervened to forestall a sharp yen selloff that could gain momentum once the currency breaks below the 160 level, he said.
The rest of this Reuters story, filed from Tokyo on Thursday, is hidden behind their paywall — and I found it in a GATA dispatch yesterday. Another link to it is here.
![]()
Banks on Edge, Finance Ministry on Alert: Mythos A.I. Panic Explained
A new kind of threat is forcing governments around the world to act quickly. When Union Finance Minister Nirmala Sitharaman called top bankers into a high-level security meeting last month, the message was unusually stark. The threat on the table wasn’t a malware strain or a ransomware gang. It was an AI model. Called Claude Mythos, the system is widely seen as a potential inflection point in cybersecurity. Not because it attacks systems directly, but because it can find ways to break them faster than humans ever could.
The finance ministry described the risk as “unprecedented“. The choice of word caught attention. Governments rarely escalate language unless the risk cuts across the entire financial system.
What Is Mythos AI?
Mythos is an advanced AI model developed by Anthropic. Unlike conventional cybersecurity tools that detect known threats, Mythos is believed to identify unknown vulnerabilities-the so-called “zero-day” flaws.
These are the most dangerous bugs in software. No one knows they exist until they are exploited.
In theory, Mythos can:
- Scan systems and detect hidden weaknesses
- Suggest ways to exploit those weaknesses
- Compress weeks of hacking effort into hours
In fact, Anthropic itself has refused to release the AI model publicly. This alone signals how sensitive it is. However, the company has provided controlled access to select firms like Apple and Goldman Sachs. The concern around the AI model escalated further after reports suggested unauthorised access to the model may have already occurred.
This interesting and somewhat disturbing story from ndtv.com Internet site on Wednesday, is something I saved for today’s column because of its content. I thank Patrik Ekdahl for this one as well — and another link to it is here.
![]()
Gradually Transitioning to Suddenly — Doug Noland
The ISM Manufacturing Index was unchanged at a four-year high of 52.7, with 13 industries reporting growth versus only three experiencing contraction. Notably, Prices Paid surged almost six points to a much stronger-than-expected 84.6 points – the highest since March 2022. The Manufacturing PMI Index jumped two to a near four-year high 54.5. The Output index rose to the high since April 2022. Elsewhere, Housing Starts popped to a much stronger-than-expected 1.502 million annualized rate, the strongest since December 2024.
April Personal Income was reported up 0.6% (double forecast), the high since July’s 0.7%. Up 0.9%, March Personal Spending was the strongest since December 2024 (1.0%). At 5.7%, y-o-y spending growth was the most robust since January 2025 (6.0%). March’s 3.5% y-o-y PCE (Personal Consumption Expenditures) reading – the Fed’s preferred inflation indicator – was the highest since May 2023 (4.0%).
Overheating risks are today highly elevated. Bubble “Terminal Phase” dynamics are by their nature highly unpredictable, capricious, and precarious. Destabilizing liquidity overabundance is a hallmark, the upshot of rapid system Credit growth coupled with exorbitant leveraged speculation.
As we’ve witnessed, it’s a fine line between liquidity overabundance associated with melt-up speculative excess – and “risk off” speculative deleveraging and liquidity challenges. Shorting and hedging play prominently. Market pullbacks see heavy hedge fund shorting and market-wide put option buying, setting the stage for intense reversals powered by short covering and the unwind of hedges. FOMO kicks in and it’s off to the races. Squeezes, unwinds, and leveraged speculation are powerful liquidity creators and financial conditions looseners.
When President Trump is asked about gas prices, he now quickly shifts the conversation to record stock prices. A booming stock market seems central to the administration’s midterms campaign strategy. But at this point, a surging equities Bubble and attendant loose conditions risk acute bond market instability. At this stage of the cycle, overheating and inflation risks are both highly elevated and responsive to loose conditions.
Doug’s weekly commentary is always worth reading — and this iteration showed up on his website sometime before midnight PDT last night. Another link to it is here.
![]()
‘Sporadic Clashes‘ in Strait of Hormuz After U.S. Attacks & Disables Two Iran Vessels Trying to Breach Blockade
Summary
- Sporadic clashes between Iranian Armed Forces and U.S. vessels in the Strait of Hormuz, few details given.
- Two more empty Iranian-flagged tankers come under U.S. aerial attack for attempting to breach blockade.
- Iran says U.S. violated ceasefire after last night’s US action, which resulted in Iranian military deaths & injures. However, Tehran still reviewing U.S. peace proposal.
- Tasnim news agency: Iran has seized an oil tanker, accusing it of “attempting to disrupt oil exports and the interests of the Iranian nation.”
This longish news item was posted on the Zero Hedge website at 11:00 a.m. on Friday morning EDT — and another link to it is here.
![]()
INTEL Roundtable w/Larry Johnson & Ray McGovern…plus Scott Ritter: Weekly Wrap. — May 8
This very interesting and informative 35-minute video interview with the above three qualified persons was hosted by Judge Andrew Napolitano late on Friday afternoon EDT — and is definitely worth your while if you have the interest. I thank Guido Tricot for sending it our way — and the link to it is here.
![]()
Tether Gold tops $3.3B as demand for bullion-backed tokens rises
Tether’s tokenized gold product, Tether Gold (XAUt), saw reserves expand sharply in the first quarter as investor demand for bullion increased amid macroeconomic uncertainty ahead of the Iran war.
In its latest report, Tether said XAUt surpassed $3.3 billion in market capitalization during the first quarter, representing a 36% increase over the period.
The company disclosed that 707,741 XAUT tokens were in circulation at the end of the quarter, with each token backed by one troy ounce of physical gold held in reserve.
Tether attributed the growth to a broader “flight to hard assets” as investors sought refuge from geopolitical tensions and shifting monetary conditions.
The increase comes amid a volatile quarter for gold. Prices climbed early in the year as investors moved into safe-haven assets, driven by geopolitical tensions and expectations that the Federal Reserve would begin cutting interest rates.
This brief gold-related article from the Cointelegraph.com Internet site on Tuesday was picked up by msn.com — and I found it on Sharps Pixley. Another link to it is here.
![]()
RBI Repatriates 104 Tonnes of Gold from London to Domestic Vaults in FY26
RBI has successfully repatriated 104.23 metric tonnes of gold from the United Kingdom to domestic vaults during the second half of FY26. India now stores nearly 77% of its total gold reserves at home. This strategic shift aims to bolster sovereign security and minimize exposure to global geopolitical weaponization of financial assets.
India is physically reclaiming its wealth. For the third consecutive year, the Reserve Bank of India (RBI) has executed a high-security “gold lift,” shifting billions of dollars worth of bullion from the Bank of England to vaults within Indian borders.
As of March 2026, India’s total gold holdings stand at 880.52 metric tonnes. Of this, 680.05 tonnes are now stored domestically, primarily in high-security facilities in Mumbai and Nagpur.
Why Move it Now?
While the Bank of England has been India’s primary storehouse for decades, the geopolitical landscape has shifted. The 2022 freezing of Russia’s foreign reserves by Western powers served as a catalyst for central banks worldwide to rethink “offshore” storage.
By moving gold to Indian soil, the RBI is ensuring its most critical safe-haven asset is beyond the reach of external jurisdictions. This “de-risking” strategy ensures that India maintains absolute control over its reserves during potential global financial or political “black swan” events.
This gold-related news story appeared on the republicworld.com Internet site at 1:29 p.m. IST on their Friday afternoon — and I found it on Sharps Pixley. Another link to it is here.
![]()
QUOTE of the DAY
![]()
The WRAP
“Understand this. Things are now in motion that cannot be undone.” — Gandalf the White
![]()
Today’s pop ‘blast from the past’ was written by this British rock band’s lead vocalist and guitar player, Mark Knopfler, in 1977 — and was lead track from their debut album.
It reached the top five in Canada, South Africa, and the United States, and the top 10 in the United Kingdom, Ireland, and Australia. It remains a staple of classic rock radio and is one of the band’s most recognisable songs.
The lyrics were inspired by a performance of a Dixieland jazz band playing in the corner of an almost empty pub in Deptford, South London. At the end of their performance, the singer announced their name, the Sultans of Swing.
The rest, as they say, is history — and the link is here. Of course there’s a bass cover to this — and that’s linked here.
Today’s classical ‘blast from the past’ is the Violin Concerto in D minor, Op. 47 of Jean Sibelius, which he originally composed in 1904 and revised in 1905 — and is the only concerto of any type that he composed. It is symphonic in scope and includes an extended cadenza for the soloist that takes on the role of the development section in the first movement.
The première, on 08 February 1904, with Sibelius conducting was a disaster …as the violinist he chose…Victor Nováček…just wasn’t up to it. Sibelius had barely finished the work in time for the première, giving Nováček little time to prepare — and the piece was of such difficulty that it would have sorely tested even a player of much greater skill.
But the soloist in this performance has no trouble with it…American violinist Joshua Bell…who I met once when he was fresh out of Julliard back in 1985 when he was only 17 years young. He was playing some work with the Edmonton Symphony Orchestra when I was on its board of directors — and at time when we could afford his fee.
Here he is with the Oslo Filharmoniske Orkester under the baton of Maestro Vasily Petrenko in a live performance on 24 November 2011. The link is here.
![]()
Like you, I was happy to see the precious metals close higher on the day… despite the fact that it was a Friday…with a non-farm payroll number that ‘da boyz’ could have used as an excuse to bash everything in sight.
As it was, it was obvious that all four of them would have closed far higher than they were allowed to. And as I pointed out further up…it was another day where ‘da boyz’ wouldn’t allow precious metal prices to fully reflect the continuing decline in the U.S. dollar.
The standout feature once again was the fact that the gold stocks far outperformed the silver shares…even though silver far outperformed the gold price yet again. And as I also pointed out earlier, the silver equities were up 10.5% after the first twenty-minutes of trading…but someone was there to sell them down hard for the third day in a row.
Volumes once again were very light in silver — and fumes & vapours in gold…so the collusive commercial traders had little trouble keeping their respective rallies contained. Open interest in both precious metals continues to creep quietly higher…but still remain at 17-year lows.
Gold’s rally was capped and turned lower before it could infringe on its 50-day moving average — and silver’s rally was stopped in its tracks — and not allowed to close too far above it 50-day m.a. It’s three bucks and small change above it at the moment.
Platinum remains above its 50-day by a hair — and despite the fact that palladium closed up on the day in the spot market…it was closed down 20 bucks in its current front month, which is September.
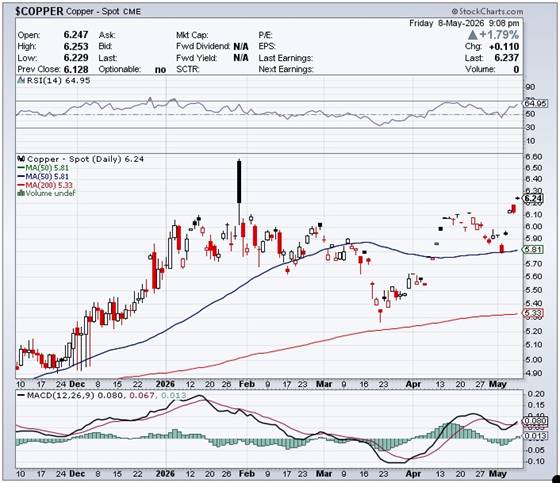
Copper shook off its tiny loss on Thursday, as it closed up 11 cents on Friday at $6.24/pound.
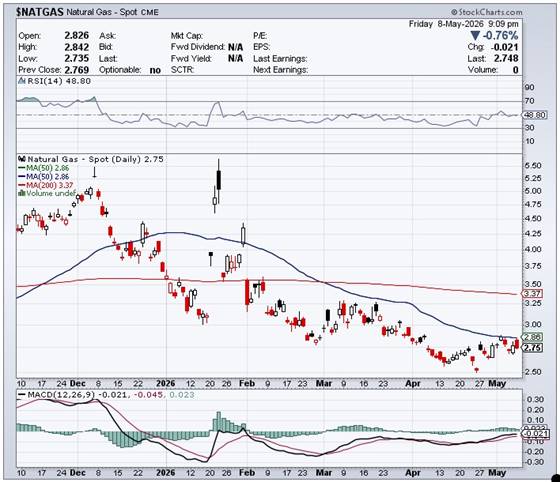
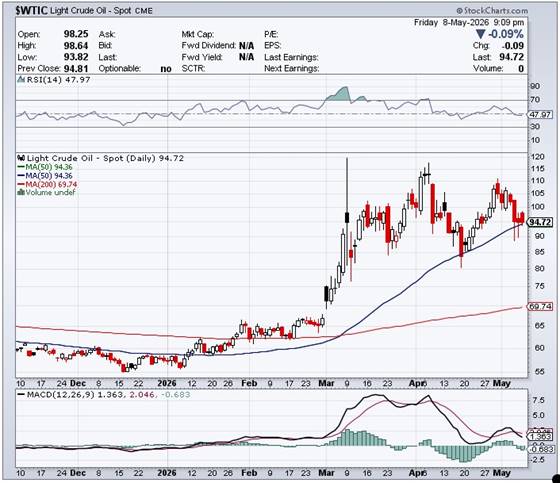
Natural gas [chart included] was closed lower by 2.1 cents — and finished the day at $2.75/1,000 cubic feet. WTIC traded in a five dollar price range on Friday — and finished it lower by an inconsequential 9 cents at $94.72/barrel.
Here are the 6-month charts for the Big 6+1 commodities, as of their closes on Friday…courtesy of stockcharts.com as always. Click to enlarge.
With the exception of Monday, it was a good week for the precious metals…but it’s way too soon to assume that it’s up, up and away from here. The collusive commercial traders remain very active — and are obviously keeping them on short leashes, as every breakout attempt has been brutally capped — and turned lower.
It’s also too soon to tell if their respective 50-day moving average are being defended — and the reason I’m pointing that out is because their last respective assaults on those marks about three weeks ago, were turned lower. So I’m on the alert for a repeat performance in the days ahead.
Don’t forget that ‘da boyz’ are in full control of their respective prices — and can paint any chart pattern they wish. However, they’re not infallible.
It’s obvious that if the Big 8 commercial traders weren’t active in the precious metals space 24/7 as not-for-profit sellers/short sellers of last resort…we would know they’re true free-market prices in days…if not hours, in the mother of all short squeezes…Ted Butler’s ‘Bonfire of the Silver Shorts‘.
Open interest in both silver and gold are still at rock bottom — and mostly at levels not seen since mid 2009. This is particularly the case in silver. Net daily trading volumes remain eerily low…so low in fact that it feels unnatural.
And because it’s so unnatural, it’s hard to predict what it portends for the future…as this is terra incognito, as I’m stated before. I can speculate by assuming that…combined with the near record low rock-bottom short positions held by the Big 8 commercial traders…that they’re making preparations for whatever ‘great reset’ is coming down the pipe — and ‘da boyz’ are just keeping things in a quiet holding pattern until they’re ready.
Of course, also looming in front of us out there in the mist is that structural deficit brick wall in silver. The only reason we haven’t hit it already is because of the largess of JPMorgan…the Kingpin in all things silver related. Net of the 103 million ounces that Ted Butler said they hold in trust for SLV…their stockpile in its own COMEX warehouse is down to a bit under 100 million troy ounces.
But as I point out in every Saturday column further up, JPMorgan’s silver holding are not just confined to its own warehouse, as they also hold silver in their name at some of the other COMEX depositories. But which ones they are — and how much silver is involved, is unknown.
The other thing that’s not known is how much of the silver they hold in any depository, including their own, is for their own account…or being held for clients. The silver held in the Eligible category gives us a hint…but doesn’t differentiate between those two classes of holders.
Here’s a 10-year chart showing total COMEX silver warehouse stocks that I posted earlier this week. Just eye-balling it, a rough guess would be that around 220 million ounces have departed all COMEX warehouses combined starting around mid October when the LBMA ran into a force majeure issue. Click to enlarge.
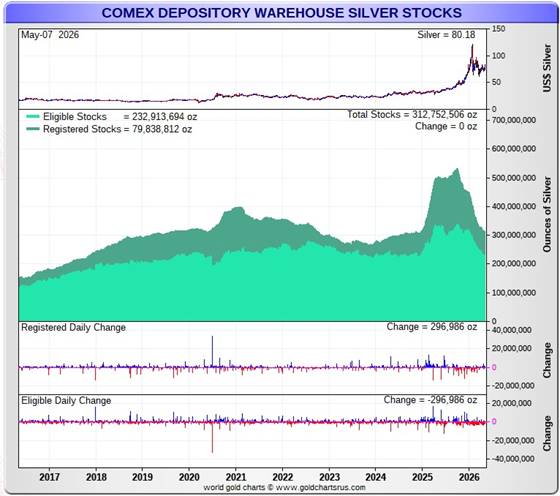
The rate of decline is decreasing…but hasn’t stopped entirely. If Ted was right when he made his inquiries about JPMorgan holding that 103 million troy ounces of silver in trust for SLV, then that takes the Eligible category down to around 130 million ounces, which isn’t a lot — and an amount that is decreasing all the time. That silver held in trust for SLV can’t be in the Registered category for obvious reasons…besides which, there only a bit under 80 million oz. in that category at the moment.
Of course not all of the remaining 130 million oz. is available for sale, either… not by a long shot…which leaves exactly how much left to continue to feed the ongoing structural deficit?
And to add to this witch’s brew, are the goings-on over at the Shanghai Gold Exchange and Shanghai Futures Exchange this year. By mid-March, they had collectively run their inventories down to a tad under 20 million oz. Since then, they’ve added a bit under 30 million ounces…all of which had to come out current global mine production…or imports from the West.
Up to the end of Q1/2026…India had imported 49.64 million troy ounces, which is a lot for them…but not a record amount. But on the other hand, the Republic of Türkiye has turned into a silver stacker extraordinaire so far this year…as they’ve already imported a record 25.21 million oz. up until the end of April.
So this confluence of forces coming from the East appears to have all the hallmarks of an undeclared physical short squeeze against the west — and its bullion banks. How soon it will be allowed to manifest itself in its price in the COMEX futures market, remains to be seen. But as you can see from the price action since the beginning of the year, the Big commercial shorts seem determined to fight this battle down to almost the last good delivery bar.
Trump is heading off to China in the next ten or so days…with nothing to offer. He’s been saying lately that he holds all the cards…but what he really has to offer Beijing is a busted Straight…of Hormuz…regarding the ongoing conflict in Iran.
According to the experts, this war will be reignited, intensified and expanded …as will the Russia/Ukraine conflict — and if that indeed turns out to be the case, then WW3 will be on in earnest.
So we wait some more.
For all those reasons stated above…which are more than enough…I’m still quite content to be “all in” and, as always, will remain so to whatever end.
I’m done for the day — and the week — and I’ll see you here on Tuesday.
Ed


