Technical Scoop: Whim Churn, K Sign, Copper Recipe

Excerpt from this week’s: Technical Scoop: Whim Churn, K Sign, Copper Recipe
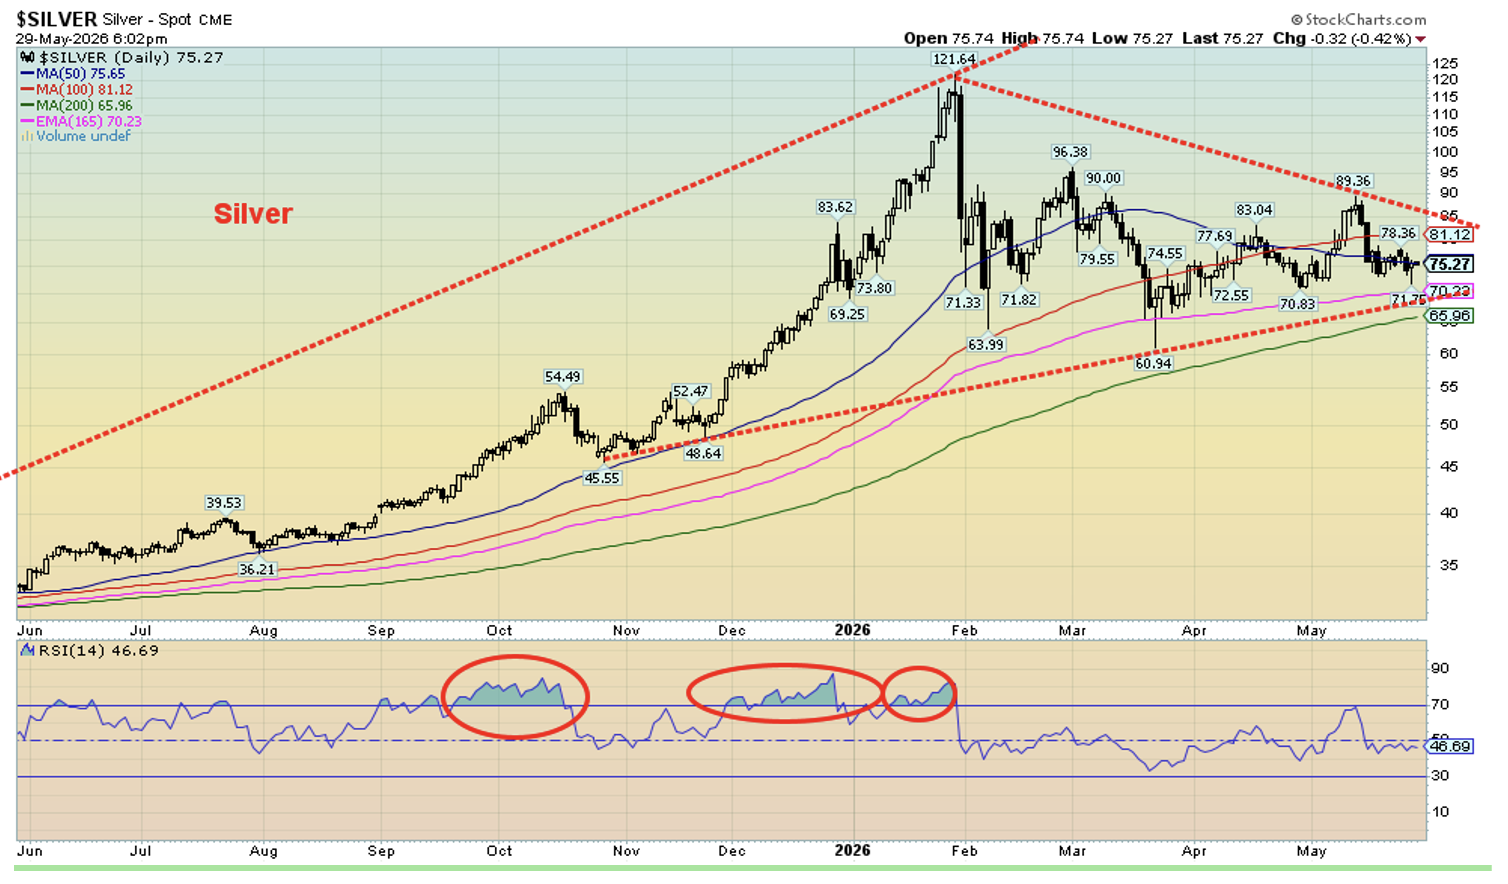
Gold and silver
Source: www.stockcharts.com
Lower oil prices, which in turn sparks lower bond yields, are music to gold’s ears. With oil plunging this past week, gold rose, continuing its ongoing whipsaws of the past few months. Yes, the war against Iran will be entering its fourth month this week. As a result, gold rose this past week, offsetting the previous week’s loss by gaining 0.8%. The lower US$ Index didn’t hurt. Silver was up only 0.1%, but the gold stocks responded positively as the Gold Bugs Index (HUI) rose 5.0% while the TSX Gold Index (TGD) jumped 4.8%. There was even positive movement in the junior gold market this past week, helping the TSX Venture Exchange (CDNX) to a gain of 3.9%. Platinum didn’t fare as well, falling 0.3%, while the near precious metals rose with palladium up 1.1% and copper gaining 0.2%. Small but significant gains.
Despite the gains this past week, gold lost 1.8% in May while silver gained 2.1%. The HUI was up 1.8% and the TGD was up 3.4%. We’ll just call it a holding pattern. That’s what the chart indicates to us as gold, we believe, continues to form what appears to be a large symmetrical triangle. The trouble is now we are near the end of the apex, which usually translates into just wiggling through rather than a breakout in either direction. In other words, our near-term expectations are more of the same while the triangle pattern takes on new formations. Ultimately, however, the pattern remains bullish, and the break should be to the upside. Risk remains for a further decline towards $4,000 which would in effect suggest a downside break, initially, at least. The good news is that we are moving into a more friendly seasonal period for gold and silver. However, what we can’t tell is whether the low will be in June or July.
Right now, for an upside breakout we’d like to regain over $4,800. Silver needs to break over $86 and hold on in further pullback to $65. Nonetheless, the five-point pattern that has formed should be ultimately bullish.
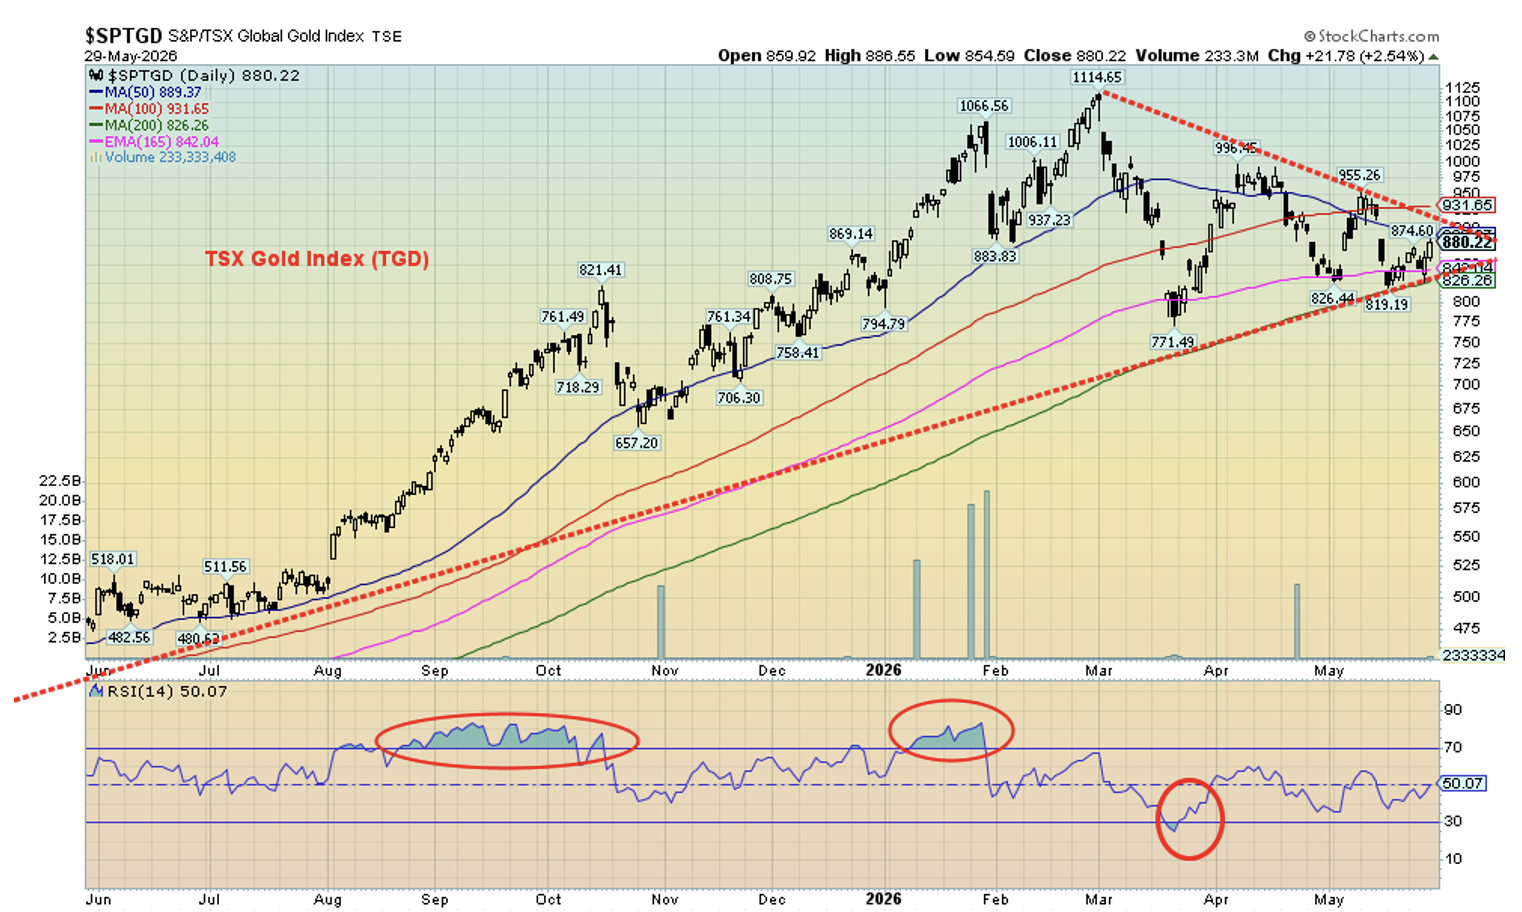
Source: www.stockcharts.com
Silver has fared better overall. The gold/silver ratio has fallen from 107 in April to near 60 today. That’s a considerable gain for silver vis-à-vis gold, which is why we touted silver as the place to be. And the gold stocks too. The TGD is down 21% from its all-time high but up 268% since a low seen in February 2026. That’s significant. Even with these sharp gains there has been little sense that gold stocks have been in a bubble. They remain undervalued. Even the CDNX has doubled since late 2023, taking numerous junior gold miners to new heights as well. But even here we sense no bubble conditions, yet. The CDNX could double again from here. The CDNX remains down 70% from its all-time high recorded in 2008.
Gold is buoyed by the thoughts of the ceasefire along with lower bond yields. But will it hold? No ceasefire is in place, and a deal could fall apart any time. In theory, the two sides remain far apart. None of this precludes owning some gold exposure of at least 10%. For safety, hold gold bullion; for speculation, junior mining development stocks.
Source: www.stockcharts.com
Read the FULL report here: Technical Scoop: Whim Churn, K Sign, Copper Recipe
Copyright David Chapman 2026
Disclaimer
David Chapman is not a registered advisory service and is not an exempt market dealer (EMD) nor a licensed financial advisor. He does not and cannot give individualised market advice. David Chapman has worked in the financial industry for over 40 years including large financial corporations, banks, and investment dealers. The information in this newsletter is intended only for informational and educational purposes. It should not be construed as an offer, a solicitation of an offer or sale of any security. Every effort is made to provide accurate and complete information. However, we cannot guarantee that there will be no errors. We make no claims, promises or guarantees about the accuracy, completeness, or adequacy of the contents of this commentary and expressly disclaim liability for errors and omissions in the contents of this commentary. David Chapman will always use his best efforts to ensure the accuracy and timeliness of all information. The reader assumes all risk when trading in securities and David Chapman advises consulting a licensed professional financial advisor or portfolio manager such as Enriched Investing Incorporated before proceeding with any trade or idea presented in this newsletter. David Chapman may own shares in companies mentioned in this newsletter. Before making an investment, prospective investors should review each security’s offering documents which summarize the objectives, fees, expenses and associated risks. Although Artificial Intelligence (AI) may be deployed from time to time, AI output is monitored and adjusted, if necessary, for accuracy. David Chapman shares his ideas and opinions for informational and educational purposes only and expects the reader to perform due diligence before considering a position in any security. That includes consulting with your own licensed professional financial advisor such as Enriched Investing Incorporated. Performance is not guaranteed, values change frequently, and past performance may not be repeated.


