
Silver Investments Accumulation Strategy as Its Correction Comes to an End…
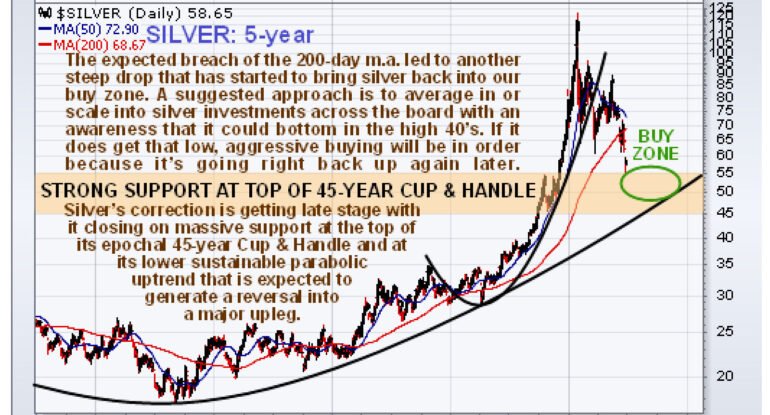
We are going to take a fresh look at silver because, after its latest drop, it is getting very close to our target zone where it and silver investments become a strong buy. It should be emphasized here that we do not have a fixed and rigid downside target, but rather a buy zone where the further it drops into it, the more of a buy it becomes. So the intelligent strategy here is to “average down” which means that you do some buying as it enters the target zone and buy more the further it drops into it and if silver should dip below $50, serious buying will be in order for reasons that will become apparent as we examine the charts.
We will start by looking at a 5-year chart for silver to gain an overall perspective. Here we see that after the parabolic blowoff late in January, the price broke down below the shorter-term parabolic uptrend that had become impossibly steep and it followed that up by breaking down below the 200-day moving average that had also been rising steeply, as expected and predicted on the site. This damaged sentiment and led to it tumbling further towards the strong support shown which all along we have been expecting to call a halt to the correction and give birth to the next major uptrend that in due course should drive the price comfortably to new highs. This chart clearly shows that silver is still in a major bull market, as evidenced by its still being well above its longer-term parabolic uptrend and it is viewed as no coincidence that this parabolic uptrend is rising steadily into the zone of massive support shown which as we know is due to its marking the upper boundary of the gigantic 45-year Cup & Handle pattern that we have looked at on numerous occasions on the chart going back to 1980, which of course reinforces its importance as a major buy zone. Having breached the support of the 200-day moving average, silver is wandering around in a sort of “no-mans land” just above the strong support, and the more it dips into it, the more of a buy it is and the position of the parabolic uptrend makes clear to us that it could wander around in this area for some time, allowing sentiment to recover before it regains upside traction and that should afford time for us to accumulate silver investments at favorable prices on dips.

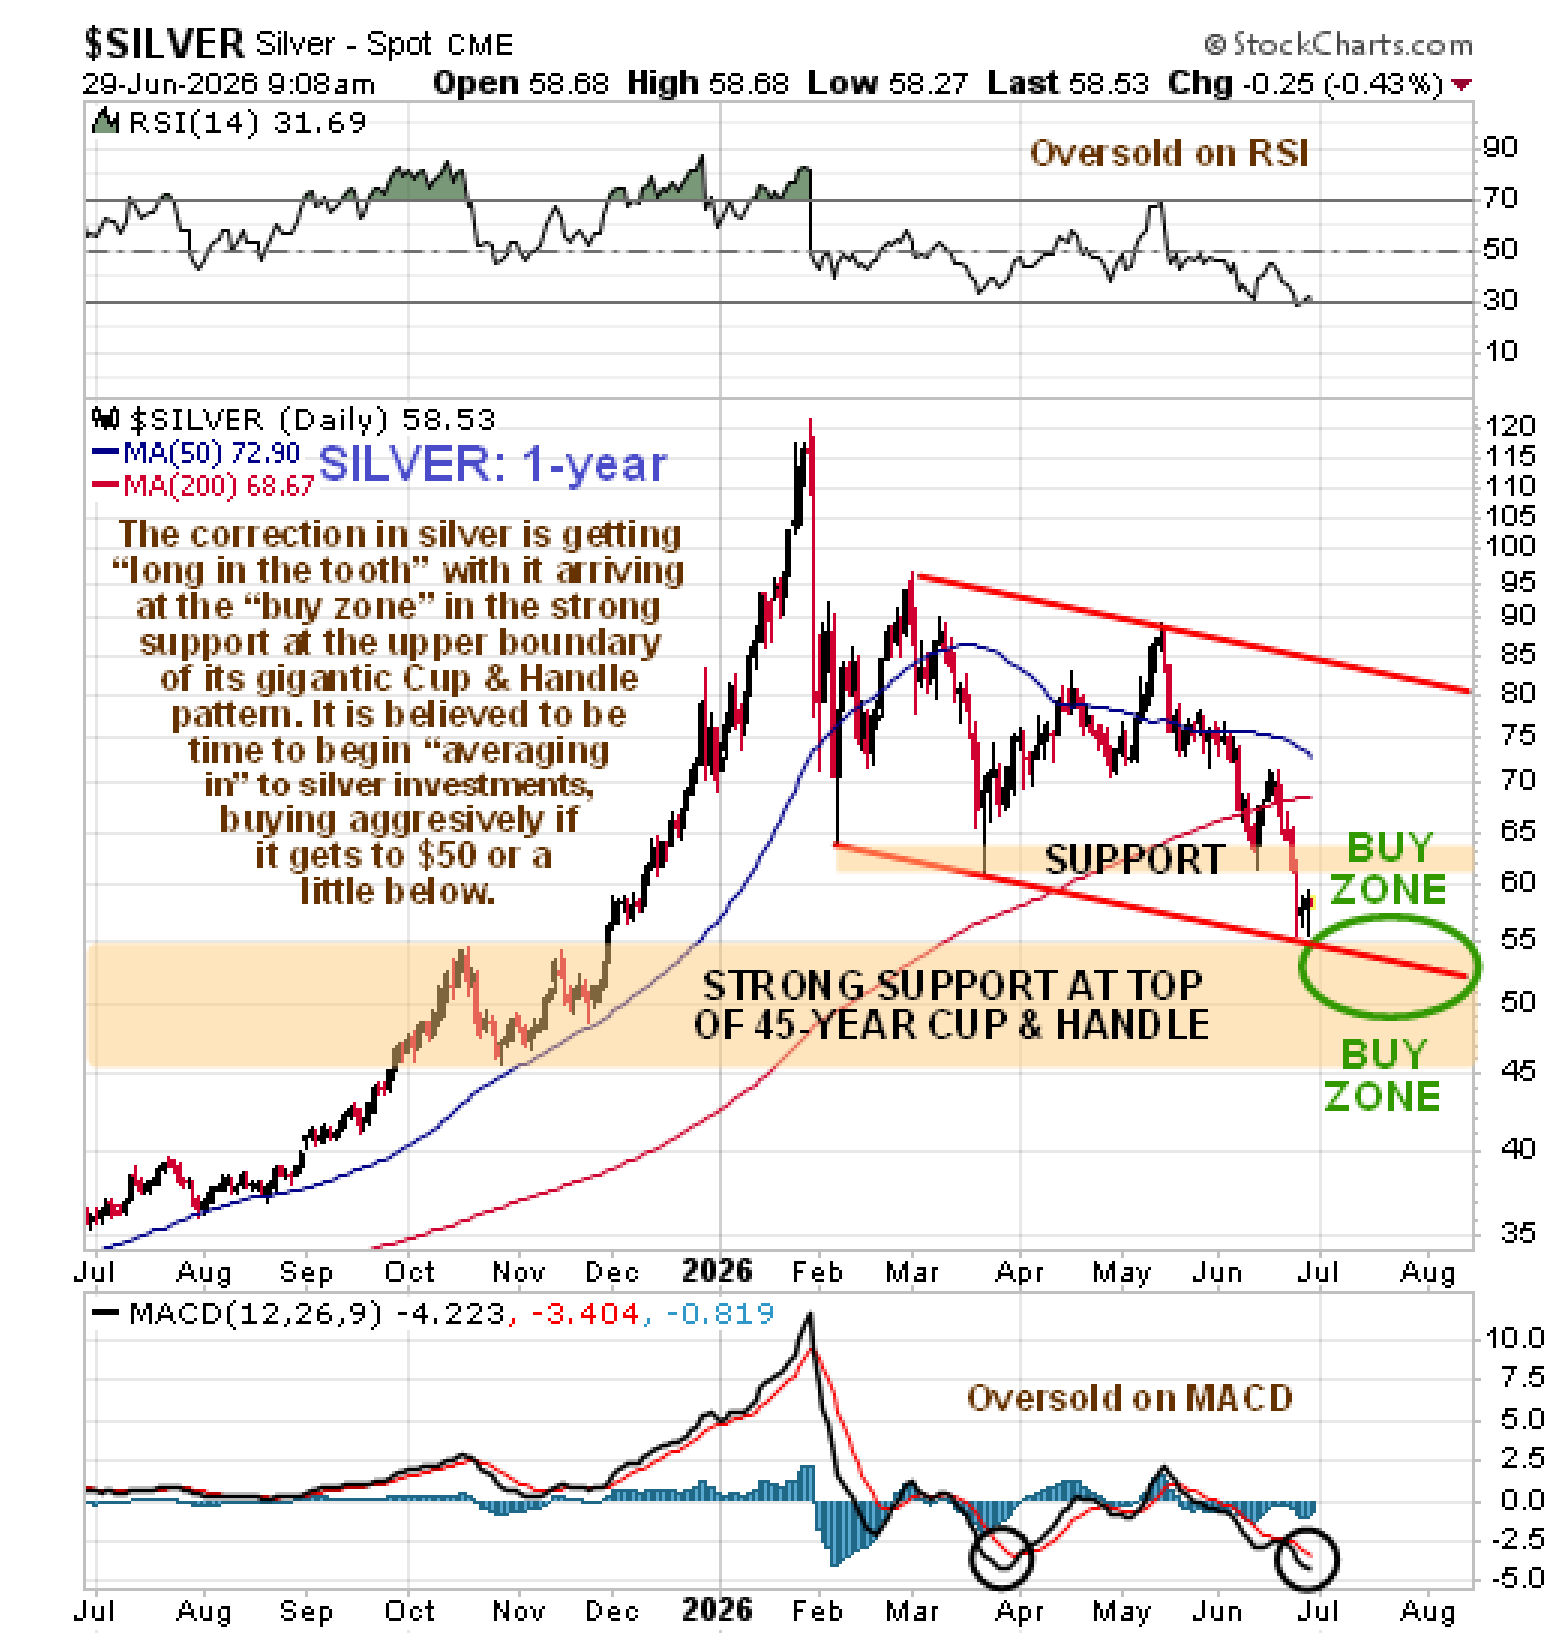
Zooming in via the 1-year chart enables us to examine the correction in much more detail. This chart reveals that silver is trending gently lower within the parallel downtrend channel shown and that right now it is short-term oversold at the lower rail of the channel and is therefore entitled to bounce. However, that said, it just breached a narrow but fairly important support level at about $62 – $63 which means that this support has now become resistance to any near-term advance.
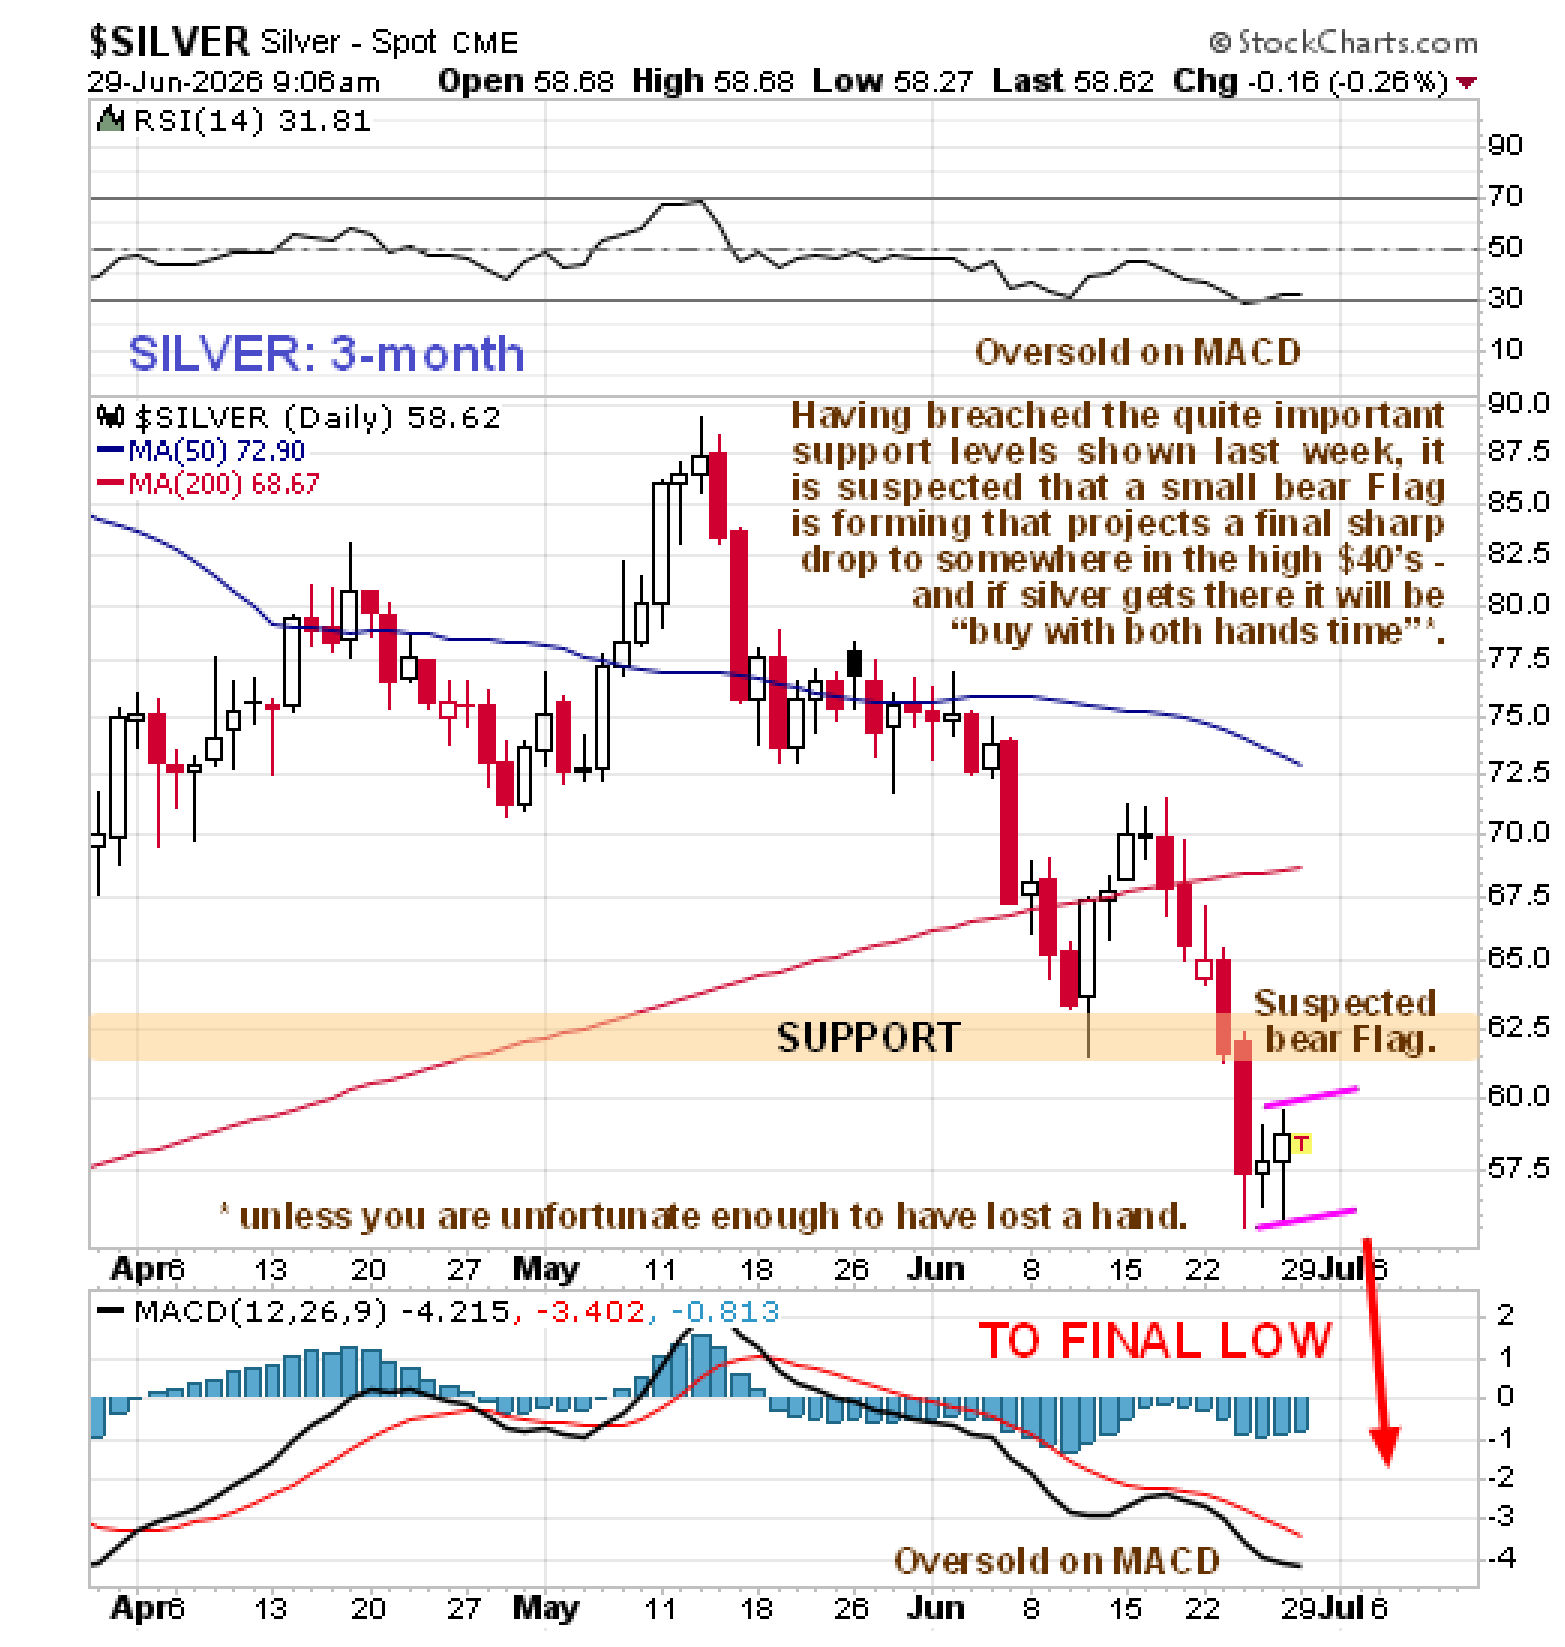
Looking at recent action in much more detail still on a short-term 3-month chart enables us to see that the sharp break below the fairly important support at $62 has been followed by a tight little trading range that is suspected to be a bear Flag, and if this is what it is, it will be followed by another sharp downleg into the massive support that should mark the end of the correction from the January peak. This interpretation is supported by the gap down on heavier volume on the break lower by silver proxy iShares Silver Trust SLV, (not shown) that has been followed by light volume on the subsequent frail attempt to rally.
 So, to sum up, silver’s correction is coming to an end and it’s time to start scaling in to silver investments, aware that it could drop a bit more, in which case buying can be stepped up. If it should start to advance without delay we will adjust our strategy accordingly. We will therefore be reviewing a range of better silver stocks going forward
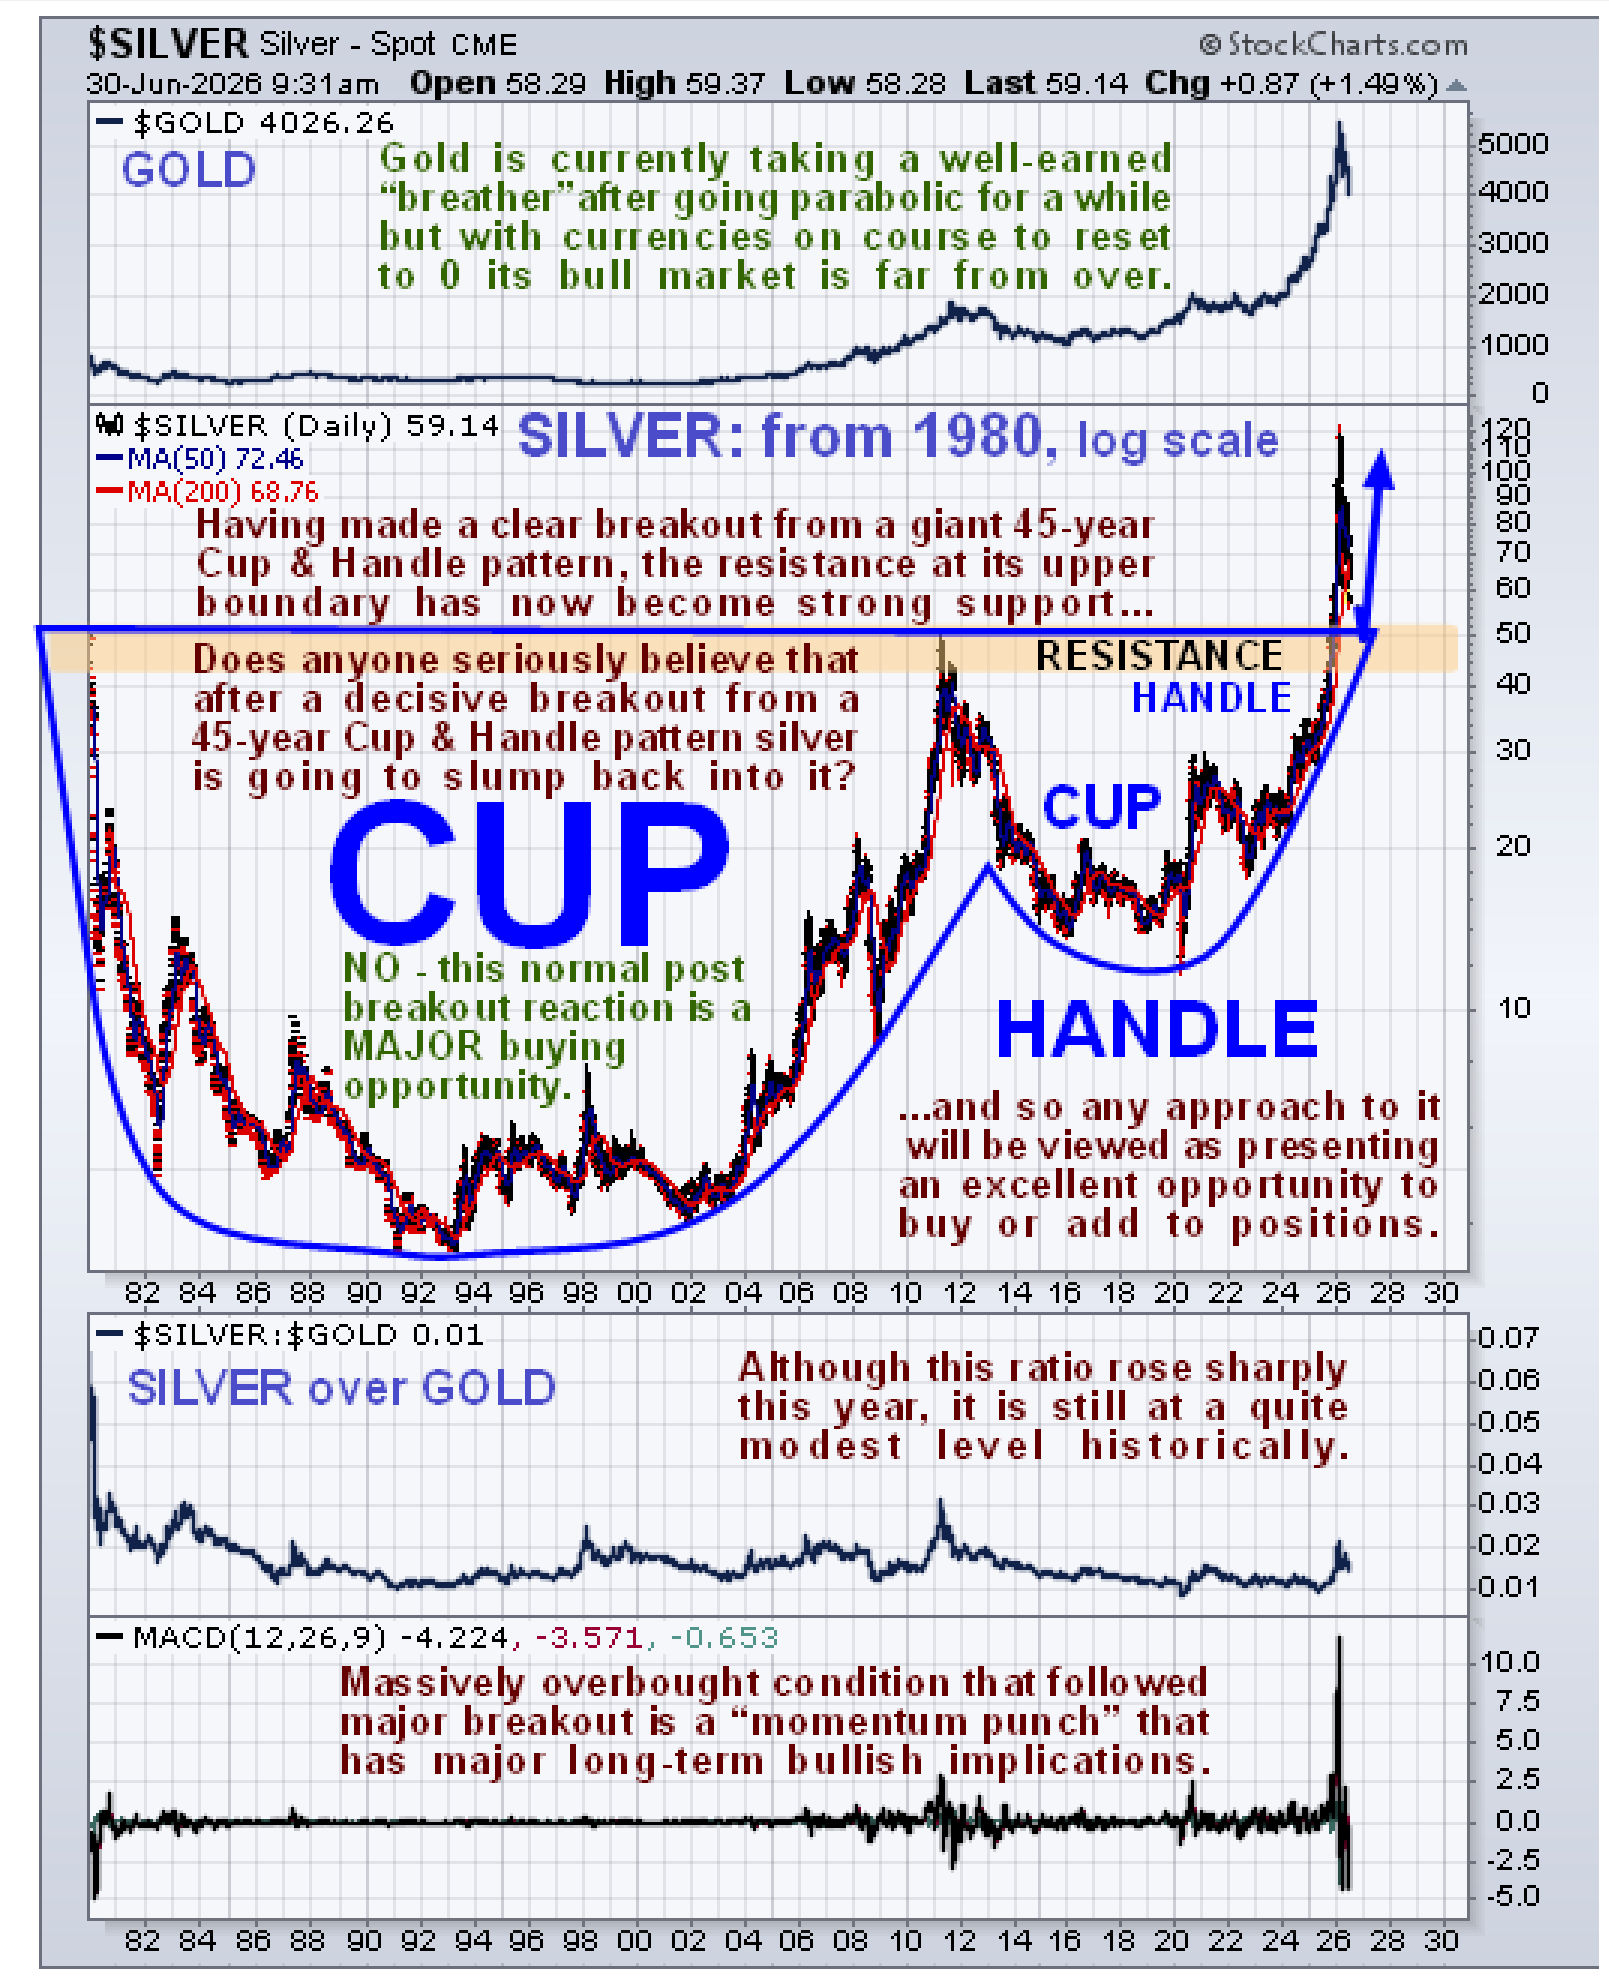
Finally, our very long-term chart for silver that goes all the way back to 1980, which has been wheeled out on several occasions over the past year, makes it very clear why silver is now in a new – and very bullish – paradigm. For on this chart we see that the parabolic runup into late January involved a powerful breakout from a gigantic 45-year Cup & Handle holding pattern and involved a “momentum punch”, the huge unprecedented spike in the MACD indicator shown at the bottom of the chart which demonstrates that this was a powerful breakout with huge significance. Most of the traders currently agonizing over whether silver drops another $5 or $10 from its current price “can’t see the wood for the trees”. What does it matter if the price goes up into the several hundreds of dollars, which it will due to continually accelerating money creation, as Egon Von Greyerz keeps repeating, and he’s right, and an important message like that is worth repeating. WHAT THIS MEANS IS THAT THE CURRENT NORMAL POST –BREAKOUT REACTION BY SILVER BACK TO THE STRONG SUPPORT AT THE BREAKOUT POINT IS PRESENTING AN INCREDIBLE OPPORTUNITY TO BUY THE SECTOR, so it really isn’t worth splitting hairs about whether it drops another few dollars more before it starts higher again.
 In the light of these observations, we will be looking very soon at a wide range of quality silver investments on the site as has been planned for some time.
End of update.
Posted at 3.35 pm EDT on 29th June 26. Very long-term silver chart added on the 30th.


