
The Big 8 Shorts Get Stuffed Again
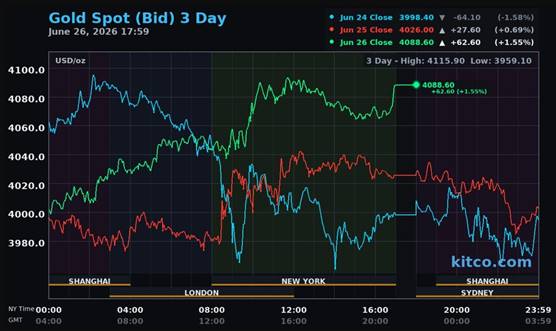
The gold price was engineered two steps lower shortly after the Globex open at 6:00 p.m. in New York on Thursday evening…setting is low tick at 10:57 a.m. in Shanghai on their Friday morning. Its ensuing rally attempt was allowed to last until around 10:20 a.m. in COMEX trading in New York. It hung in at that price until 12:30 p.m. EDT — and then was sold/engineered quietly lower until minutes after 3 p.m. in after-hours trading. It developed a slight positive bias…until it really took off higher about five minutes before the market closed at 5:00 p.m.
The low and high ticks in gold were recorded as $3,998.10 and $4,111.50 in the August contract, the new front month for gold as of the COMEX close yesterday — and an intraday move of $113.40 an ounce. The August/October price spread differential in gold at the close in New York yesterday was $29.00 …October/ December was $31.60 — and December/February27 was $32.60 an ounce.
Gold was closed on Friday afternoon in New York at $4,088.60 spot…up $63.00 on the day — and $118.90 off its Kitco-recorded low tick. Net volume was only a bit above fumes & vapours at 102,000 contracts in August…gold’s new front month — and there were just under 17,000 contracts worth of roll-over/switch volume on top of that.
I saw that only 19 gold, plus 4 silver contracts were traded in June yesterday and, as is always the case, it remains to be seen just how much of these amounts show up in tonight’s Daily Delivery and Preliminary Reports further down in today’s column.
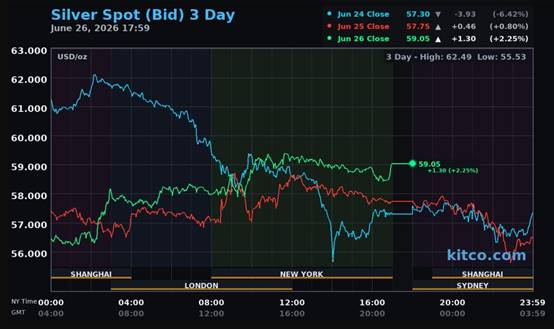
Silver’s price path was managed in a similar fashion as gold’s…including the time of its engineered low tick — and it big but brief rally going into the Globex open in London got clubbed into submission. It then took one step higher in early COMEX trading in New York — and after that its price path was the same as gold’s…including the jump higher in the last five or so minutes of after-hours trading.
The low and high ticks in it were $56.13 and $60.00 in the September contract …now the new front month for silver — and an intraday move of $3.87 the ounce. The July/September price spread differential in silver at the close in New York yesterday was 45.0 cents…September/December was 65.1 cents — and December/ March27 was 66.5 cents an ounce.
Silver was closed in New York on Friday afternoon at $59.05 spot…up $1.29 on the day — and a whopping $3.47 off its Kitco-recorded low tick. Net volume was fumes & vapours once more at 26,000 contracts in September, silver’s new front month — and there were just under 33,000 contracts worth of roll-over/switch volume in this precious metal.

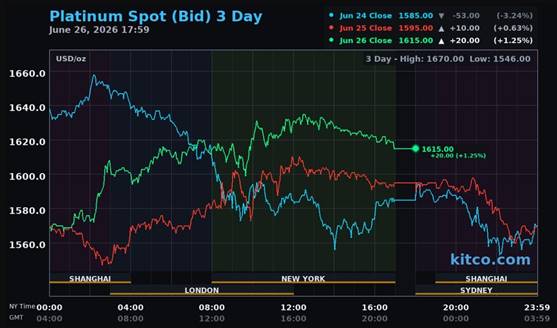
Platinum’s engineered low tick was set at the same time as the other three precious metals — and its ensuing rally ran into ‘da boyz’ at 12:30 p.m. in COMEX trading in New York. It was then sold/engineered quietly lower until the market closed at 5:00 p.m. EDT. Platinum was closed at $1,615 spot…up 20 bucks from Thursday — and 22 dollars off its Kitco-recorded high tick.
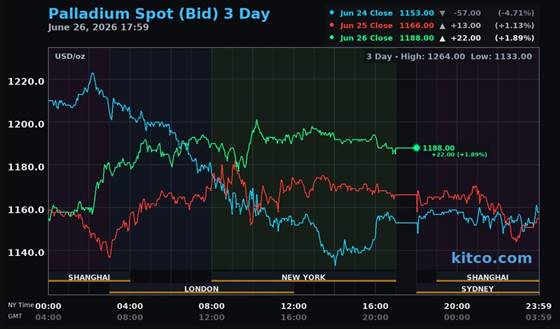
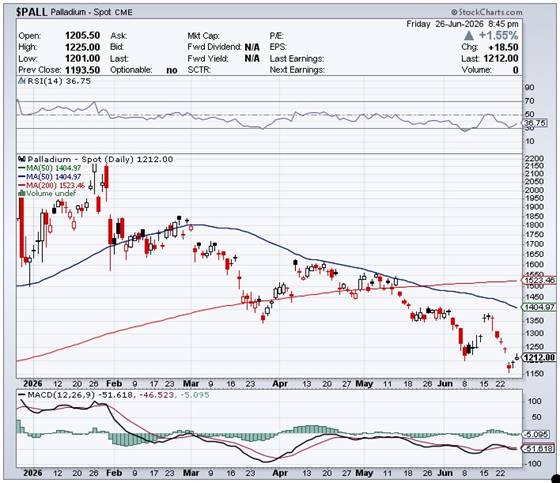
Palladium’s price path was similar to platinum’s…including the time of its engineered low tick — and its ensuing rally got stepped on at 10:15 a.m. in COMEX trading in New York. It was sold quietly and a bit unevenly lower from that juncture until the market closed at 5:00 p.m. EDT. Palladium was closed at $1,188 spot…up 23 dollars on the day — and 13 bucks off its Kitco-recorded high tick.
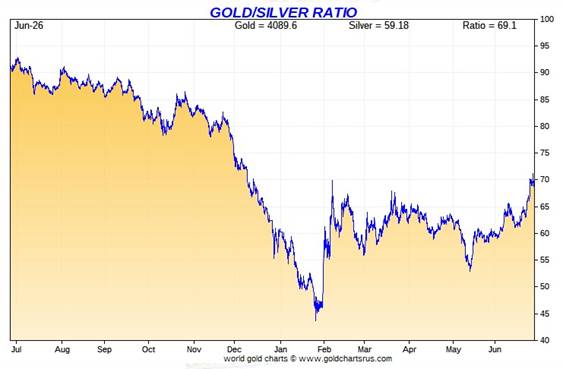
Based on the kitco.com spot closing prices in silver and gold posted above… the gold/silver ratio worked out to 69.2 to 1 on Friday…compared to 69.7 to 1 on Thursday.
Here’s the 1-year Gold/Silver Ratio chart from Nick Laird — and updated with this past week’s data. Click to enlarge.
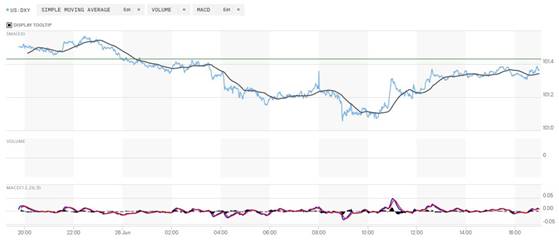
The dollar index closed very late on Thursday afternoon in New York at 101.43 — and then opened higher by 8 basis points once trading commenced at 7:45 p.m. EDT on Thursday evening…which was 7:45 a.m. China Standard Time on their Friday morning. It then had an ascending down/up move that ended at 10:27 a.m. CST. From that point it stair-stepped its way broadly and very quietly lower until it appeared to get ‘saved’ at 8:58 a.m. in New York. Its ensuing ‘rally’ ended around 12:37 a.m. EDT — and from that point it chopped very quietly sideways until trading ended at 5:00 p.m.
The dollar index finished the Friday trading session in New York at 101.36 …down 7 basis points from its close on Thursday.
Here’s the DXY chart for Friday…thanks to marketwatch.com as usual. Click to enlarge.
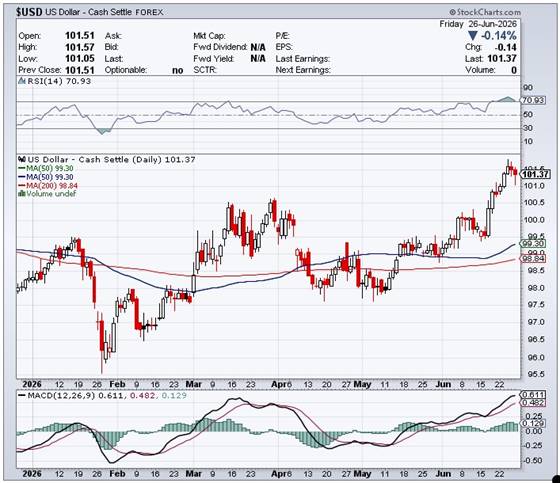
Here’s the 6-month U.S. dollar index chart…courtesy of stockcharts.com as usual. The delta between its close…101.37…and the close on DXY chart above, was 1 basis point above that. Click to enlarge.
That inconsequential down/up move in the dollar index was not a factor in the precious metal price action on Friday.
U.S. 10-year Treasury: 4.3720%…down 0.0200/(-0.46%)…as of the 1:59:55 p.m. CDT close
The ten-year yield’s 4.4100% spike high tick was set at 8:18 a.m. CDT/9:18 a.m. EDT — and then the Fed stepped in to ensure that its yield closed down on the day.
For the week just past, the ten-year was closed down 7.90 basis points — and only down because of the continuous intervention by the Fed…with yesterday’s action being the latest poster child for that.
Here’s the 5-year 10-year U.S. Treasury chart from the yahoo.com Internet site — which puts the current yield into a somewhat longer-term perspective. Click to enlarge.
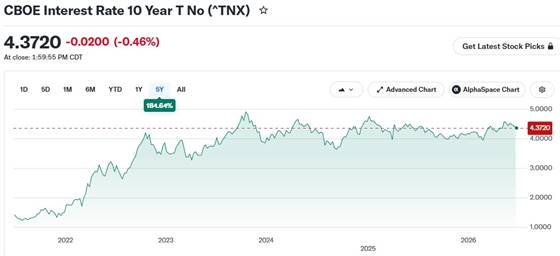
It still hasn’t been allowed to take out its 4.92% high of October 15, 2023 — and it’s more than obvious that the Fed isn’t going to allow that to happen any time soon. It closed above the 4.50 mark at 4.536% two weeks ago on Friday — and I made the comment in last Saturday’s column that it would be of some interest to see if the Fed would allow that to last. They didn’t. So yield curve control continues…even thought not a word has been spoken about it in the main stream press.

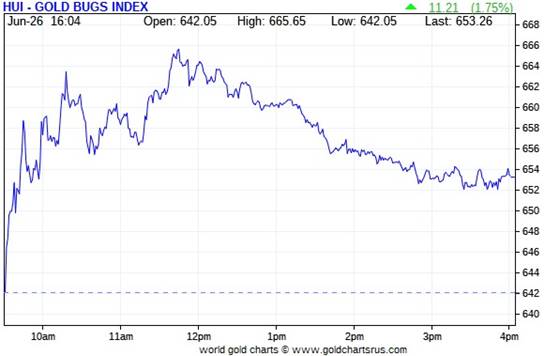
The gold stocks chopped unevenly higher as soon as trading commenced at 9:30 a.m. in New York on Friday morning — and that lasted until ‘da boyz’ stepped on the gold price at 10:15 a.m. in COMEX trading. From that point the gold shares followed the gold price lower until minutes before the markets closed at 4:00 p.m. EDT — and they then ticked a tad higher from there. The HUI closed up 1.75 percent.
The price path of the silver equities was mostly similar to what happened with the gold shares…except the high tick in the silver stocks was set at 12:42 p.m. EDT. After that, their price path was identical to what happened in the HUI. Nick Laird’s Silver Sentiment Index closed higher by 2.49 percent. Click to enlarge.
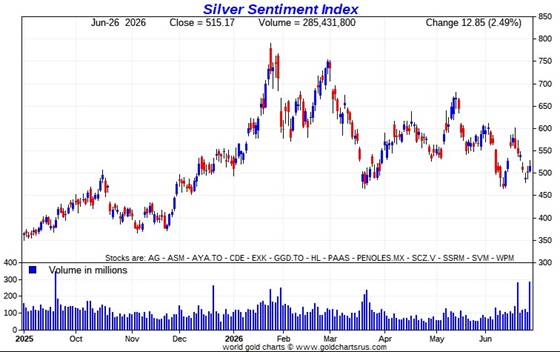
The absolute star yesterday was Aya Gold & Silver…as it closed up 8.61 percent on no news that I could see. The biggest underperformer — and the only one that closed down on the day, was Peñoles…closing lower by 1.95 percent.
There was this news from SSR Mining.
Silver closed higher by 2.25% on Friday — the Silver Sentiment Index finished the day up 2.49% — and Sprott’s PSLV finished the day higher by 1.91%
Gold closed higher by 1.55%…the HUI closed up 1.75% — and Sprott’s PHYS closed higher by 1.19%
The Shanghai/U.S. price premium in silver was only 9.67 percent on their Friday.
The reddit.com/Wallstreetsilver website, now under ‘new’ and somewhat improved management, is linked here. The link to two other silver forums are here — and here.

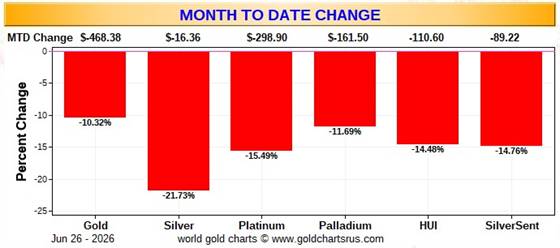
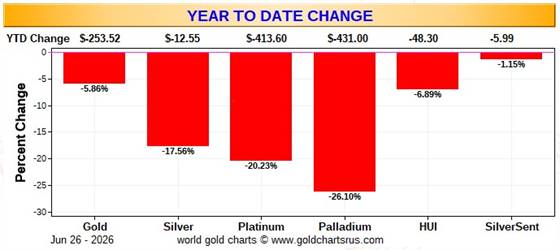
Here are the usual three charts that appear in this spot in every weekend missive. They show the changes in gold, silver, platinum and palladium in both percent and dollar and cents terms, as of their Friday closes in New York — along with the changes in the HUI and the Silver Sentiment Index.
Here’s the weekly chart — and it should come as no surprise that it’s wall-to-wall red after the pounding that the collusive commercial traders laid on the precious metals this past week. The standout feature here is the ‘outperformance’ of the silver shares vs. the silver price…compared to the gold stocks vs. the gold price. It’s stark. Click to enlarge.

Here’s the month-to-date chart — and it’s even more butt-ass ugly this week than last — and we can thank the collusive commercial traders of whatever stripe for this one — and the year-to-date chart below as well. The silver and gold equities performed about the same, even though the silver price was crushed a bit more than twice as much as the gold price in percentage terms. Click to enlarge.
Here’s the year-to-date chart — and there’s no green to be seen but, once again, the standout is how well the silver equities have held up, despite the fact that the commercial traders have its underlying precious metal down almost 18% on the year. All three of these charts are collateral damage when ‘da boyz’ are running one of their patented ‘wash, rinse & spin’ cycles in the Globex/COMEX futures market. It’s of great interest that the silver shares are outperforming the metal itself by as much as they are. Click to enlarge.
Despite the fact that silver has now broken the $120 barrier…albeit briefly — and the silver well in London came close to running dry last October…the gold/silver ratio remains at a farcical 69.2 to 1 as of Friday’s close. The ‘normal’ and historical ratio is around 15 to 1…which would put silver at a bit under $270 based on gold’s closing price on Friday. And if priced at the ratio of 7:1 that it comes out of the ground at…compared to gold…that would put silver at a bit under $585 an ounce. So a rather impressive triple-digit silver price is in our future…most likely somewhere between those two numbers.
As I say in this spot every Saturday…all that remains to be resolved is what that price will be — and how soon ‘da boyz’ allow it to happen. Its first attempt to reach one of these values back at the end of January was obviously crushed …as were all the rest since then. But in the face of the continuing structural deficit in silver — and all the other stuff going on in the world today, they can’t keep it up forever. I’ll have a bit more on this in The Wrap.

The CME Daily Delivery Report for Day 21 of June deliveries showed that 7 gold — and zero silver contracts was posted for delivery within the COMEX-approved depositories on Tuesday…the last delivery day of the month.
In gold, the two biggest short/issuers were Advantage and ADM…issuing 3 contracts each out of their respective client accounts. The only long/stopper of the three in total that mattered was BofA Securities, picking up 5 contracts for their house account.
In palladium, there were 5 contracts issued and stopped.
And in copper, there were 521 contracts/13.025 million pounds issued and stopped on Friday…386.700 million pounds for the month of June in total.
The link to yesterday’s Issuers and Stoppers Report is here.
Month-to-date — and with the June delivery month now in the history books, there were 40,841 gold contracts issued and stopped — and that number in silver was 2,592 COMEX contracts.
On First Notice Day for June back on May 29, there were 25,381 gold contracts still open this month — and that number in silver was 2,147 COMEX contracts. The standout here are 15,460 COMEX gold contracts added to June as the delivery month progressed…a 60.9% increase from May 29th.
In silver, the increase was a surprisingly small 20.7% increase as the month progressed.
The CME Preliminary Report for the Friday trading session showed that gold open interest in June fell by 2,226 COMEX contracts, leaving just 7 left…minus the 7 contracts out for delivery on Tuesday as per the above Daily Delivery Report. Thursday’s Daily Delivery Report showed that 2,220 gold contracts were actually posted for delivery on Monday…so that means that 2,226-2,220=6 more gold contracts were added to the June delivery month…which is now complete.
Silver o.i. in June dropped by 117 contracts, leaving 2 left — and there are no silver contracts out for delivery on Monday as mentioned a bunch of paragraphs ago. Thursday’s Daily Delivery Report showed that 118 silver contracts were actually posted for delivery on Monday…so that means that 118-117=1 more silver contract was added to June deliveries.
Total gold open interest in last night’s Preliminary Report increased by 1,632 COMEX contracts — and total silver o.i. rose by 2,460 contracts.
[I checked the final change in total open interest for gold for Thursday — and it showed a slight decrease…from +3,303 COMEX contracts, down to +2,844 contracts. The final change in total silver o.i. for Wednesday also showed a small decrease…from -879 contracts, up to -1,170 COMEX contracts.]
Gold open interest inJuly in Friday morning’s final report from the CME Group increased by a further 214 contracts, leaving 7,686 contracts still open — and silver o.i. July fell by a further 8,432 contracts, leaving 14,657 contracts still around.
There were withdrawals from both GLD and SLV on Friday…as authorized participants removed 64,242 troy ounces of gold from the former — and 1,401,699 troy ounces of silver from the latter. But a surprising 3,957 troy ounces of gold were added to GLDM.
The SLV borrow rate started the Friday session at 0.40% — and ended at 0.47% …with 9.3 million shares available to short. The GLD borrow rate started the day at 0.35 percent — and ended at 0.38 percent…with 4.2 million shares available.
In other gold and silver ETFs and mutual funds on Earth on Friday …net of any changes in COMEX, GLD, GLDM and SLV activity, there were a net 188,472 troy ounces of gold were taken out — and a net 655,360 troy ounces of silver were withdrawn as well.
There was pretty decent activity in gold over at the COMEX-approved depositories on the U.S. east coast on Thursday. Nothing was reported received…but 132,496 troy ounces were shipped out.
The largest ‘out’ amount were the 96,742.359 troy ounces/3,009 kilobars that left JPMorgan. The remaining 35,754 troy ounces departed Manfra, Tordella & Brookes, Inc.
There was pretty hefty paper activity, as 154,603 troy ounces were transferred from the Registered category and back into Eligible…105,393 troy ounces at HSBC USA…with the remaining 49,210 troy ounces making that trip over at Asahi.
The link to all of Thursday’s COMEX gold action is here.
The COMEX silver action on Thursday was piddling — and all of it took place at Delaware. One good delivery bar/1,067 troy ounces was received — and three good delivery bars/2,972 troy ounces were shipped out. There were 70,323 troy ounces transferred from the Eligible category and into Registered at Delaware as well. The link to Thursday’s COMEX silver activity is here.
The Shanghai Futures Exchange updated their silver inventories as of the close of business on their Friday — and it showed that a net and further 182,617 troy ounces/ 5.680 metric tonnes of silver were withdrawn… leaving their silver inventories at 27.103 million troy ounces/842.985 metric tonnes.

Here are the usual 20-year charts that show up in this space in every weekend column. They show the total amounts of physical gold and silver held in all known depositories, ETFs and mutual funds as of the close of business on Friday. Click to enlarge.
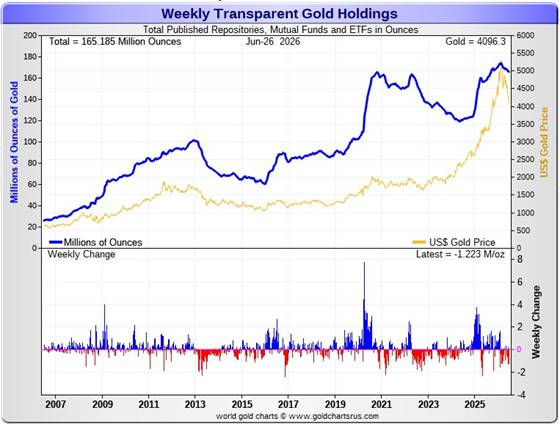
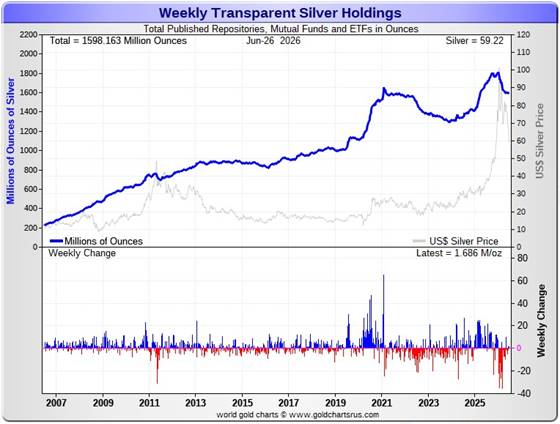
During the business week just past, there were a net and further 1.223 million troy ounces of gold withdrawn — but a net 1.686 million troy ounces of silver were added.
According to Nick Laird’s data on his website, a net 2.468 million troy ounces of gold were removed from all the world’s known depositories, mutual funds and ETFs during the last four weeks. The only ‘in’ amount worth mentioning were the 181,547 troy ounces deposited into India’s various and sundry ETFs.
The largest two ‘out’ amounts by far were the 780,958 troy ounces that left SLV …followed by the 605,496 troy ounces that departed the COMEX. Next down the list were the 274,570 troy ounces withdrawn from China’s various and sundry gold ETFs.
The amount of gold in all the world’s ETFs and mutual funds is now a bit below its old all-time high of late 2020…see the above chart. But it should be far higher…considering gold’s current price…far more than double it was back then. I suspect it has a lot to do with the ‘everything bubble’ in the equity markets — and the current ‘wash, rinse & spin’ cycle by the collusive commercial shorts.
However, a surprising and net 2.186 million troy ounces of silver were added during that same 4-week time period.
The largest ‘in’ amount were the 6.192 million troy ounces into the COMEX… followed by the 1.510 million troy ounces into WisdomTree.
The largest ‘out’ amounts were the 4.281 million oz. that left SLV — and the 2.190 million oz. out of Aberdeen.
It should be noted that the amount of silver held in all these depositories, ETFs and mutual funds remains below its old all-time high inventory level of January 2021. But it should be far higher than it is as well, because silver is about 2.2x the price it was back then.
Back at its previous inventory peak in late January 2021, silver was around $27 an ounce. Now its about 32 bucks higher. Why the precious metal ETFs aren’t doing better is a mystery for which I have few answers….except for what was mentioned a few paragraphs ago.
Retail demand remains comatose — and there are no ‘out of stock’ signs over at all the retail bullion stores that I follow. They have decent stocks in just about everything they normally carry. The buy/sell spreads at most bullion stores remain a bit north of 10 percent — and in the case of anything less than 0.999+ pure, it’s far more than that. This obviously means that they have lots of stock — and are not at all enthusiastic about buying anything.
COMEX silver withdrawals had been monstrous up until recently…135 million in Q1/2026…23 million oz. in April — but only 12.6 million oz. in May — and nothing worth mentioning in June so far. As you can see, withdrawals from the COMEX have imploded in the last few months.
These amount don’t include the 12.960 million oz. issued and stopped on the COMEX in the June delivery month. But this is not really silver demand per se…as all that’s happening is that silver already sitting on the COMEX just changes ownership.
But silver demand from the COMEX can only go on for so long, as a huge chunk of silver sitting on the COMEX is owned privately in the Eligible category — and not for sale or delivery. Just how much silver is actually available for shipment on demand to the LBMA of elsewhere, is unknown…but it’s most certainly finite.
We’re also well into the sixth year of a structural deficit in silver according to the ongoing reports from The Silver Institute. However, subscriber John Macintosh thinks it’s far more than they’re reporting — and threw the b.s. flag on their latest report in an essay headlined “The Silver Institute Strikes Again” — and linked once more here.
The vast majority of precious metals being held in these depositories are by those who won’t be selling until the silver price is many multiples of what it is today…if ever.
Sprott’s PSLV is the third largest depository of silver on Planet Earth with 215.6 million troy ounces…unchanged for the last three weeks — and a great distance behind the COMEX, which has now been demoted to the second largest silver depository, where there are 323.4 million troy ounces being held…up a net 4.0 million troy ounces over the last two weeks…but minus the 103 million troy ounces being held in trust for SLV by JPMorgan that Ted Butler found out about many years ago.
That 103 million ounce amount brings JPMorgan’s actual silver warehouse stocks down to around the 36 million troy ounce mark…quite a bit different than the 138.5 million they indicate they have — down a net 1.3 million troy ounces over the last two weeks. They’ve parted with a lot of silver in the last eight or so months…around 75 million oz.
But that number doesn’t include the silver that JPMorgan owns and has stored at the other COMEX-approved depositories. They’ve shipped out lots of that over the months and years…especially this year so far — and a lot of it out of CNT.
PSLV remains a very long way behind SLV as well — still the largest silver depository…with 480.6 million troy ounces as of Friday’s close…down a net 400,000 troy ounces over the last two weeks.
On a net basis since the latter parts of December — and despite the big spike in the silver price at the end of January, just about every depository or ETF had been hemorrhaging silver. However, that outflow has declined precipitously over the last three months…as I pointed out a bunch of paragraphs ago regarding the COMEX.
The latest short report [for positions held at the close of business on Monday, June 15] showed that the short position in SLV rose by 18.88%…from the 26.92 million shares sold short in the prior report…up to 32.00 million shares in the latest short report that came this past Thursday. This amount represents 6.01 percent of total SLV shares outstanding…still a bit obscene, but not nearly as bad as it was early in the year. Don’t forget that there’s no physical silver backing any of these shorted shares as the SLV prospectus requires.
BlackRock issued a warning more than ten years ago now to all those short SLV, that there might come a time when there wouldn’t be enough metal for them to cover. That would only be true if JPMorgan decides not to supply it to whatever entity requires it. Those that remain short SLV shares are in equally dire straits as the Big 8 shorts in silver in the COMEX futures market — and I suspect that they’re the same entities.
The next short report…for positions held at the close of trading on Tuesday, June 30…will be posted on The Wall Street Journal‘s website on Friday, July 10…the same day as the next Bank Participation Report.
Then there’s that other little matter of the monster short position in silver held by Bank of America in the OTC market…with JPMorgan & Friends on the long side. Ted said it hadn’t gone away. He wrote an article about this back in April 2021 headlined “A New Piece of the Puzzle” — and linked here.
In the article, the OCC Report stated that BofA had $8.3 billion in precious metal derivatives at the end of Q4/2020 — but the BofA’s derivatives position is now up to $120.7 billion as of the end of Q4/2025…an almost fifteen-fold increase.
A while after that article came out, he also come to the conclusion that they’re short around 25 million ounces of gold with these same parties as well. Once these short covering rallies in both silver and gold begin anew…we’ll see if they need to get taken over, like Bear Stearns did back in 2008 — and for the same reason. If that’s the case, JPMorgan…their counterparty to these trades …will pick them up for next to nothing as well.
According to their website, the next derivatives report from OCC will be out next week.

The Commitment of Traders Report, for positions held at the COMEX close on Tuesday, showed only a smallish decline in the Commercial net short position in silver — and an insignificant decline in gold.
In silver, the Commercial net short position declined by only 2,078 COMEX contracts…10.390 million troy ounces of paper silver.
They arrived at that number through the sale of 182 long contracts…but they also bought back/covered 2,260 short contracts — and it’s the difference between those two numbers that represents their change for the reporting week.
Under the hood in the Disaggregated COT Report, the Managed Money traders reduced their net long position by 1,144 COMEX contracts — and the Nonreportable/ small traders reduced theirs by 1,285 contracts. This meant that the traders in the Other Reportables category actually increased their net long position by a bit — and the did, to the tune of 351 contracts.
Doing the math: 1,144 plus 1,285 minus 351 equals 2,078 COMEX contracts …the change in the Commercial net short position.
The Commercial net short position in silver now stands at 40,240 COMEX contracts/201.200 million troy ounces…down those 2,078 contracts from from Monday’s COT report.
The Big 4 collusive commercial traders actually increased their net short position by 34 COMEX contracts, up to 31,811 COMEX contracts…their largest short position since March 10.
But the Big ‘5 through 8’ decreased their net short position, them by 1,899 COMEX contracts…down to 13,182 contracts…their smallest short position since February 10.
The Big 8 commercial traders in total are net short 44,993 COMEX silver contracts…down 1,899-34=1,865 contracts on the week — and about 1,600 contracts above their lowest short position I have records for.
But since the Big 8 shorts accounted for only 1,865 contracts of the decrease in the Commercial net short position — and the Commercial net short position fell by 2,078 COMEX contracts, that meant that Ted Butler’s raptors, the 35 small commercial traders other than the Big 8, had to have been buyers during the reporting week as well — and they were, increasing their net long position by 2,078-1,865=213 COMEX contracts. They are now net long silver by 4,753 COMEX contracts.
Their purchase of these long contracts by Ted’s raptors had the mathematical effect of decreasing the Commercial net short position…which isn’t a decrease at all. When these small commercial traders are net long like they are now, it’s only what the Big 8 commercial traders do that matters. It’s been like that forever.
Here’s the 3-year COT chart for silver thanks to Nick Laird — and updated with the above data. Click to enlarge.
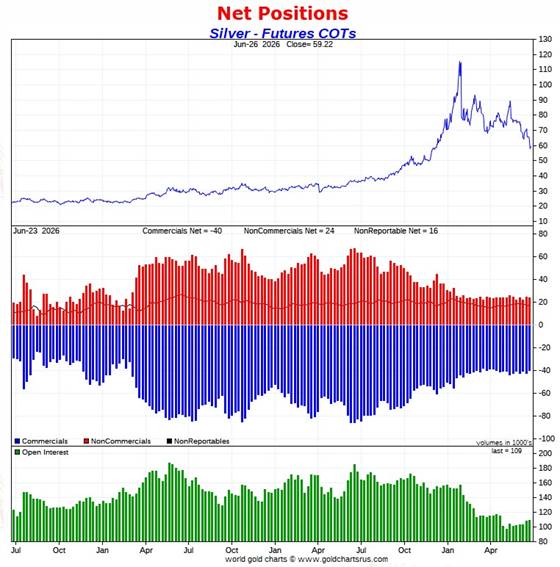
Despite closing silver far below its 200-day moving average during the reporting week, the Big 8 collusive traders had little to show for it. Like the COT Report from two weeks ago…they got royally stuffed once again…as the Managed Money traders et al. refused to follow the Pavlovian script of the past…selling in a panic when moving averages are broken to the downside.
The 2,078 short contracts they did cover in yesterday’s report…only negated the 1,950 contract increase in their short position in silver in Monday’s COT Report.
Of course ‘da boyz’ set a new low in silver on Wednesday…the day after the cut-off for yesterday’s COT Report. But using the past three weeks data as prologue, one has to suspect that the Big 8 didn’t accomplish much then, either.
The Big 8 commercial traders are net short 41.3 percent of total open interest in silver in the COMEX futures market…down a bit from the 43.5 percent they were short in last week’s COT Report. The percentage increase would have been a bit less, because it was diluted by the fact that total silver open interest rose by 1,223 COMEX contracts during the reporting week — and that obviously affects the percentage calculation.
The low water mark for the Big 8 shorts was the 43,407 COMEX contracts back on 07 April — and despite the fact that silver is lower by around ten dollars as of this past Tuesday’s cut-off, the Big 8 short position yesterday was 44,993 COMEX contracts.
Like I said…’da boyz’ have run up against that brick wall of diminishing returns …as the non-commercial traders et al. simply refuse to sell more long contracts, or go further short. For that reason, the silver price can go no lower.
And if it does go lower, like it did on Wednesday after the cut-off…it’s a given that ‘da boyz’ didn’t get much.
But in the overall, one must not overlook the fact that the short position held by the Big 8 in silver is only a hair off its lowest in history — and remains incandescently white-hot bullish from a COMEX futures market perspective.
In gold, the commercial net short position fell by a piddling 2,159 COMEX contracts…215,900 troy ounces of paper gold.
They arrived at that number through the purchase of 6,359 long contracts… but also sold/added 4,200 short contracts for whatever reason. It’s the difference between those two numbers that represents their change for the reporting week.
Under the hood in the Disaggregated COT Report, the Managed Money traders actually increased their net long position by 1,674 COMEX contracts…which meant that the other two groups of traders had to have been sellers during the reporting week — and they were. The Other Reportables reduced their net long position by 555 contracts — and the Nonreportable/small traders by 3,276 COMEX contracts.
Doing the math: 3,276 plus 555 minus 1,674 equals 2,159 COMEX contracts …the change in the commercial net short position…which it must do.
The commercial net short position in gold is now 205,404 COMEX contracts…20.540 million troy ounces…down those 2,159 contracts from Monday’s COT Report.
The Big 4 commercial traders decreased their net short position by 1,211 COMEX contracts, down to 125,019 contracts — and only 3,000 contracts above their lowest short position that I have records for.
The Big ‘5 through 8’ commercial traders actually increased their net short position by 645 contracts, up to 54,938 COMEX contracts…the second week in a row that they have increased their net short position…their largest short position since February 3.
The Big 8 commercial traders in total are net short 179,957 COMEX contracts…down only 566 contracts from last week — and still a hefty 18,059 contracts above their record low of 161,898 contracts that they were short a month ago.
But since the commercial net short position fell by 2,159 COMEX contracts — and the Big 8 decreased their net short position by only 566 contracts…that meant that Ted’s raptors, the 38 small commercial traders other than the Big 8, had to have been buyers during the reporting week — and they were. They decreased their net short position by 2,159-566=1,593 contracts — and are now net short ‘only’ 25,447 COMEX contracts…their smallest net short position since May 26.
And like they currently are in silver, they would normally be net long gold by many thousands of contracts [if not tens of thousands of contracts] at this point in the price cycle — and why they’re not this time around, I have no idea…but suspect that they have been recruited into the trenches in the fight to prevent a massive rise in the gold price. But if they weren’t short this amount — and net long those thousands [to tens of thousands] of contracts that they normally would be, it’s a guarantee that gold would be many, many thousands of dollars higher in price than it is now.
I suspect that no more than two or three of these small commercial traders hold the vast majority of this short position…so it’s the ‘Big 10 or 11’ — and not just the ‘Big 8’ traders that are running the gold price management show.
Here’s Nick’s 3-year COT chart for gold — and updated with the above data. Click to enlarge.
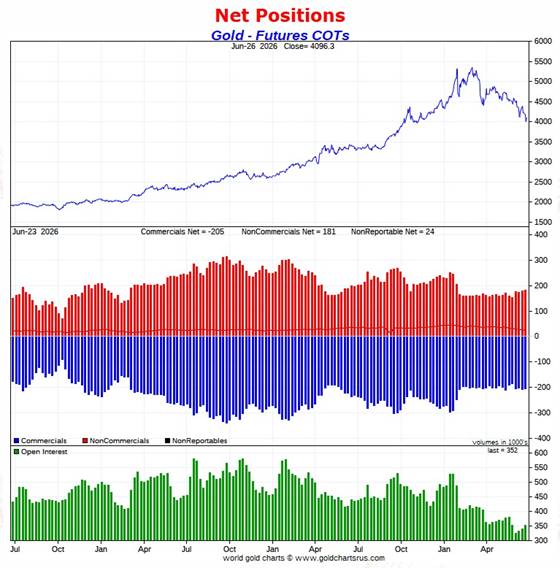
During the reporting week, the collusive commercial traders shaved 200 bucks off the gold price — and closed it even further below its 200-day moving average. Their reward for all this huffing and puffing was a piddling 2,079 contract decrease in their net short position.
So ‘da boyz’ got stuffed again in gold, too…as the Pavlovian response from the Managed Money traders was M.I.A. here as well — and another ‘come to Jesus’ moment for the collusive commercial traders of whatever stripe.
It now stands to reason that a majority of the up-until-now brain dead traders in the Managed Money traders et al. categories are now up to speed on how they’ve been screwed over for the last many decades — and their refusal to sell is a big ‘up yours’ to ‘da boyz’. Good on ’em!
And also like in silver, I doubt very much that the new engineered lows in gold that the commercial traders set since the Tuesday cut-off, helped them by much.
The Big 8 are short 51.1 percent of total open interest in gold in the COMEX futures market…down from the 53.2% they were short in last week’s report …but only down that much because of the 12,837 contract increase in gold total open interest during the reporting week…which obviously affects the percentage calculation.
However, unlike silver, the commercial net short position in gold is much larger than the Big 8 short position…because the rest of the collusive commercial traders, Ted Butler’s raptors, are also net short gold. Adding them into the mix, which you have to do, puts the commercial net short position in gold at 58.3 percent of total open interest in the COMEX futures market…down from the 61.2% that they were short in last week’s report — and only down that much for the same reason stated in the previous paragraph.
And if you subtract out the uneconomic and market-neutral spread trades from total open interest, the commercial net short position in gold soars to something north of 65% of total open interest…which is grotesque beyond belief.
But despite of ‘all of the above’…like in silver, gold remains on the launchpad for a major rally…when it’s allowed.

In the other metals, the Managed Money traders in palladium increased their net short position by 405 COMEX contracts — and are net short palladium by 4,724 COMEX contracts…the only category that’s net short palladium.
The commercial traders in the Swap Dealers category are net long palladium by 2,631 contracts — and the commercial traders in the Producer/Merchant category are finally back on the long side as well, but only a net 37 COMEX contracts. The traders in the Other Reportables are net long 1,468 contracts in this metal at the moment — and the Nonreportable/small trader categories are net long 588 COMEX contracts.
As I keep mentioning about these numbers, palladium is a very dinky market. Total open interest is only 17,149 COMEX contracts…an increase of 138 contracts this past reporting week…still about the lowest it’s been since mid-2023. Open interest in platinum is also about the lowest since that time as well.
The world’s banks are net short 9.3 percent of total open interest in palladium in the COMEX futures market as of the June Bank Participation Report that came out two weeks ago now…which is a decrease from the 12.1 percent that they were net short in May’s Bank Participation Report.
This is a very strange and twisted market once you get a look into its internal structure — and as I point out in every monthly Bank Participation Report, the only reason that there’s a COMEX futures market in palladium is so the collusive commercial traders of whatever stripe can manage its price.
In platinum the Managed Money traders actually increased their net long position by 773 COMEX contracts during the reporting week — and are net long platinum by 8,657 contracts. The traders in the Other Reportables and Nonreportable/small trader category remain net long platinum by very respectable amounts as well.
The commercial traders in the Producer/Merchant category in platinum are net short 11,119 COMEX contracts. The Swap Dealers are net short platinum by 8,004 COMEX contracts.
It’s mostly the world’s banks that are ‘The Big Shorts’ in platinum in the COMEX futures market, as per June’s Bank Participation Report that came out three weeks ago — but haven’t done much of anything in platinum in the last five months, in aggregate.
In copper, the Managed Money traders decreased their net long position by a further 2,461 COMEX contracts during the past reporting week — and remain net long copper by 66,547 contracts…1.664 billion pounds of the stuff. The traders in the Other Reportables and Nonreportable categories are net long copper as well.
Copper, like palladium, continues to be a wildly bifurcated market in the commercial category. The Producer/Merchant category is net short 97,586 copper contracts/ 2.440 billion pounds — while the Swap Dealers are net long 17,108 COMEX contracts/427 million pounds of the stuff. So it’s the commercial traders in the Producer/Merchant category that are short against every other group of traders…including the commercials in the Swap Dealer category.
Whether this dichotomy in copper means anything or not, will only be known in the fullness of time. Ted Butler said it didn’t mean anything as far as he was concerned, as they’re all commercial traders in the commercial category. But this bifurcation has been in place for as many years as I’ve been keeping records — and that’s a very long time….10+ years.
In this vital industrial commodity, the world’s banks…both U.S. and foreign… are net short copper by 2.1% of total open interest in the June Bank Participation Report. Back in the October 2025 BPR, these same banks were net long 0.90% of the total open interest in copper in the COMEX futures market. So basically they’re market neutral…but only numerically, as that dichotomy between the two groups of commercial traders is still there.
At the moment it’s all the commodity trading houses such as Glencore and Trafigura et al., along with some hedge funds, that are mega net short copper in the Producer/Merchant category, as the Swap Dealers are net long, as pointed out above.
The next Bank Participation Report for the June trading period is due out on Friday, July 10.

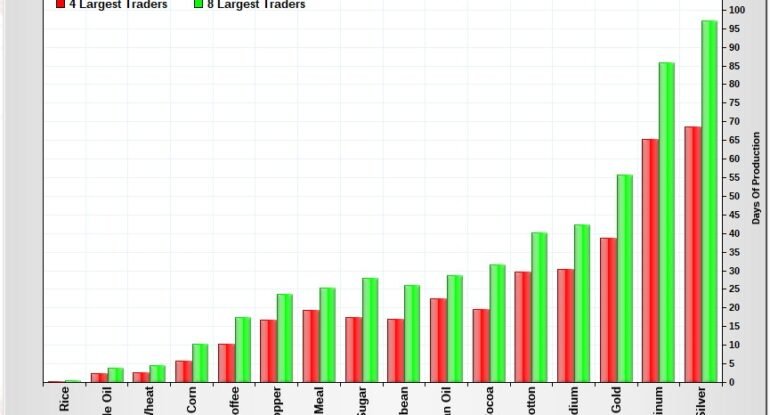
Here’s Nick Laird’s “Days to Cover” chart, updated with the COT data for positions held at the close of COMEX trading on Tuesday, June 23. It shows the days of world production that it would take to cover the short positions of the Big 4 — and Big ‘5 through 8’ traders in every physically traded commodity on the COMEX. This chart is a graphical representation of what’s shown in the COT Report above. Click to enlarge.

In this week’s data, the Big 4 traders are short about 69 days of world silver production…unchanged from Monday’s COT report. The ‘5 through 8’ large traders are short an additional 28 days of world silver production…down 4 days from Monday’s COT report…for a total of 97 days that the Big 8 are short…and obviously down 4 days from that last Friday’s COT Report.
Those 97 days that the Big 8 traders are currently short, represents about 3.2 months of world silver production, or 224.965 million troy ounces/44,993 COMEX contracts. That’s down from the 234.290 million troy ounces/46,858 contracts in this past Monday’s COT Report.
In gold, the Big 4 are short about 39 days of world gold production… unchanged from Monday’s COT Report — and the Big ‘5 through 8’ are short an additional 17 days of world production…also unchanged from Monday, for a total of 56 days of world gold production held short by the Big 8 commercial traders — and obviously unchanged from Monday’s report. This is no surprise considering that the Big 8 short position only fell by 566 COMEX contracts.
In silver, I suspect that a goodly chunk of the gross short position in the Big 4 commercial category is mostly held by only two traders…both of them U.S. banks…Wells Fargo and BofA. In the last Bank Participation Report from three weeks ago, 5 U.S. bullion banks held a gross short position of 12,884 COMEX contracts…down a whole bunch from April — and their lowest short position on record — and one has to suspect that it’s even lower than that now.
This chart is also a graphical representation of why I consider platinum to be ‘da boyz’ No. 2 problem child after silver — and it’s a big problem child.
I note, that after a two-week absence…cotton has now replaced palladium as the fourth most shorted commodity on the COMEX…but only by 2 days of world production.
The short position in SLV now sits at 32.00 million shares/troy ounces as of the latest short report that came out on Thursday, June 25…for positions held at the close of trading on Monday, June 15. This represents an increase of 18.88% from the prior report — and 6.01% of total SLV shares outstanding. This is not as off-the-charts grotesque and obscene as it once used to be — but realistically should be something less than a third of that amount.
Don’t forget that there’s not a single solitary troy ounce of silver backing any of these shorted shares as the SLV prospectus requires.
The next short report…for positions held at the close of business on Tuesday, June 30…is due out on Friday, July 10th…the same day as the next Bank Participation Report.
In the overall in yesterday’s COT Report, the short positions of the Big 8 commercial traders in silver decreased by a smallish amount…mostly the Big ‘5 through 8’. In gold, the reduction was very tiny and inconsequential from a commercial trader perspective.
As Ted Butler pointed out quite often over the years, the resolution of the Big 4/8 short positions will be the sole determinant of precious metal prices going forward…although that short position in gold held by his raptors continues to be a negative factor — and declined by a tad more during this past reporting week. However, under normal circumstances, it wouldn’t be there at all…it would be a huge long position.
And as he also pointed out over the years, there would come a time when what the numbers show in the COT Report won’t matter, as events in the real world…whatever they may be…will overtake them. That hasn’t happened yet…but that day now appears to be fast approaching.
All that we await, is the denouement that follows. The big bear raids we’ve endured over the last many months, weeks and days…are all part and parcel of the process to keep their respective prices in line until that moment arrives.

CRITICAL READS & VIDEOS
UMich Sentiment Rebounds From 46-Year Record Low In June, Inflation Fears Fade Further
Having rebounded from record (46 year) lows in preliminary June data, University of Michigan’s final June Sentiment survey was expected to show further improvement as gas prices have fallen since the U.S.-Iran ‘peace’ MoU signing.
And it did with the headline index rising from 48.9 flash and 44.8 prior to 49.5 (but that was below the 50.0 expectation)…
Both Current Conditions and the Expectations Index also rebounded with the former outperforming…
Consumer sentiment confirmed its early-month reading, rising about 10% above May as gas prices moderated.
“Increases were seen across income, wealth, and political affiliation,” Joanne Hsu, director of the survey, said in a statement.
Expected business conditions over the next five years surged 16% as consumers’ worries over long-term consequences of the Iran conflict appear to be easing.
“Still, sentiment remains in unfavorable territory at 13% below the February 2026 reading prior to the start of the Iran conflict, and nearly 20% less than a year ago.”
Year-ahead inflation expectations inched down from 4.8% in May to a still-elevated 4.6% this month.
This Zero Hedge news item was posted on their website at 10:08 a.m. on Friday morning EDT — and another link to it is here.

Trump eases pressure on Fed Chairman Kevin Warsh as inflation tops 4%
With inflation topping 4%, the Trump administration is easing off its long-standing calls for the Federal Reserve to immediately cut interest rates. That is giving new Fed Chairman Kevin Warsh an extended political grace period as he deals with a challenging economic environment, but underscores the depth of the push-back he could face if the mercurial president changes his mind.
President Donald Trump said as recently as Wednesday that he wants the Fed to cut rates. Meanwhile several of the president’s top economic advisors have in recent interviews and writing stopped short of calling for near-term rate cuts, as they had before the Iran war sent some prices surging and Trump installed Warsh as the new Fed chairman.
What might look like division is really an indication that the Trump-Warsh relationship has shifted the political gravity of the Trump administration, a White House official said, speaking on condition of anonymity to describe behind-the-scenes conversations.
“I wouldn’t say it’s necessarily a shift in policy, or how we’re seeing the data,” the official said. Rather, “personnel is big for this president,” the official said. Trump has “confidence and faith” in Warsh and so will let him make decisions that he didn’t entrust to Jerome Powell, the prior chair.
This CNBC news item comes courtesy of Swedish reader Patrik Ekdahl. It was posted on their website at 9:58 a.m. EDT on Friday morning — and update about three hours or so later. Another link to it is here.

The Treasury Secretary and the Maestro — Doug Noland
South Korea’s KOSPI equities index sank 10.0% Tuesday, rallied 3.3% Wednesday and an additional 5.4% Thursday, before sinking 5.8% in wild Friday trading. At intraday Friday lows, the index was down 9.3%. Japan’s Nikkei 225 Index was 5.4% lower at Friday’s intraday trough, ending the session with a 4.2% loss. Taiwan’s TAIEX Index lost 4.6% in Friday trading, with China’s CSI 300 Index down 3.0%, and Hong Kong’s Hang Seng Index 1.8% lower. AI Bubble leaks.
The Dollar Index traded this week to a one-year high. The Norwegian krone lost 2.3%, the New Zealand dollar 1.7%, the Australian dollar 1.7%, and the Swedish krona 1.6%. EM currency losers included the Russian ruble (6.7%), Chilean peso (2.0%), Thai baht (1.6%), Polish zloty (1.4%), and the Hungarian forint (1.3%).
The iShares Emerging Markets ETF (EEM) dropped 5.1% this week. “EM Stocks Post Worst Week in More Than Three Months on AI Rout.”
Even with Friday’s 1.5% rally, the MAG7 Index ended the week down 5.5%. At Thursday’s intraday lows, MAG7 suffered a 14% m-t-d loss. Losses this week included Nvidia 8.6%, Alphabet/Google 8.3%, Tesla 5.2%, Amazon 4.8%, Apple 4.8%, and Meta Platforms 4.7%. SpaceX sank 17.2%.
Meanwhile, weekly junk issuance surpassed $7 billion, according to Bloomberg, “the busiest since early this month.” Month-to-date issuance is a chunky $33.5 billion.
Most financial conditions indicators, however, held notably steadfast at “loose.” Considering the degree of cross asset market instability, especially volatility and losses in “big tech,” I would have expected more of a market shift to incipient risk aversion. I expect de-risking/deleveraging to gain momentum. But it’s almost as if U.S. markets assume “the fix is in” for the midterms.
Doug’s weekly market commentary put in an appearance on this website sometime before midnight PDT last night — and another link to it is here.
Two important and worthwhile video interviews
1. Judgment Day For Trump’s War. Does He Know He Lost? — Colonel Douglas Macgregor
This very worthwhile and informative video interview with the Colonel as hosted by Judge Napolitano on Friday sometime — and I found it over at theduran.com Internet site — and the link to it is here.
2. INTEL Roundtable w/Larry Johnson & Ray McGovern – Weekly Wrap 26-June
This 29-minute video interview with former CIA analysts McGovern and Johnson was hosted by Judge Andrew Napolitano very late on Friday afternoon EDT — and it’s certainly worth your time if you have the interest. It comes courtesy of Guido Tricot, of course — and the link to it is here.
U.S. strikes Iran after Trump accuses Tehran of ceasefire violation in Strait of Hormuz
The U.S. military struck Iran on Friday after President Donald Trump accused the Islamic Republic of “foolish violation” of a ceasefire agreement by launching drone attacks at ships in the Strait of Hormuz.
Iran’s military later said it had retaliated for the strikes.
U.S. Central Command said its aircraft “struck Iranian missile and drone storage locations and coastal radar sites.”
A one-way attack drone launched by Iran on Thursday struck the Singapore-flagged cargo ship Ever Lovely in the strait off the coast of Oman, Central Command said in a post on X. The vessel was able to continue on its way through the strait, which is a major thoroughfare for the shipment of oil.
Trump said the U.S. military “knocked down” three other attack drones aimed at ships in the strait.
“The unwarranted aggression against commercial shipping by Iranian forces clearly violated the ceasefire,” Central Command said.
Another CNBC story from Patrik Ekdahl. This one put in an appearance on their Internet site at 4:39 p.m. EDT on Friday afternoon…which certainly explains the jumps higher in both gold and silver in the last few minutes of after-hours trading in New York. The link to it is here.

Dunagun Kaiser of Liberty & Finance fame interviews your humble scribe
This 27-minute interview with host Dunagun Kaiser was recorded at 3 p.m. EDT on Wednesday afternoon — and if you feel that I have anything worth listening to — another link to it is here.
Gold: India swings to premium on price retreat; China demand muted
Gold started trading at a premium in India this week for the first time in a month and a half, as a price correction lifted buying, while demand stayed subdued in top consumer China.
Gold prices in India fell to 140,543 rupees per 10 grams on Thursday, their lowest level since March 27, tracking a sharp decline in international spot gold prices.
“Demand has improved somewhat after the price correction. However, retail buyers are still making only small purchases, as larger purchases remain unaffordable even at current price levels,” said Amit Modak, chief executive of PN Gadgil and Sons, a Pune-based jeweller.
Dealers quoted premiums of up to $6 an ounce over official domestic prices this week, inclusive of 15 per cent import and 3 per cent sales levies, up from last week’s discounts of up to $54.
“Demand is reviving because overseas prices are correcting and the rupee is appreciating. That is giving jewellers the confidence to make purchases,” said a Mumbai-based bullion dealer with a private bank.
The rupee rose about 0.3 per cent on Thursday to close at 94.3950 per dollar. Indian markets were closed on Friday for a holiday.
A stronger rupee reduces local prices of gold, boosting bullion demand.
This Reuters story from Friday was picked up by thehindubusinessline.com Internet site — and I found it on Sharps Pixley. Another link to it is here. Then there’s this related story from Sharps Pixley yesterday headlined “Jewellery Demand in India Resilient Despite Record-High Gold Prices: Indriya CEO” — and linked here.
QUOTE of the DAY

The WRAP
“Understand this. Things are now in motion that cannot be undone.” — Gandalf the White

Today’ pop/jazz ‘blast from the past’ is in memory of David Clayton-Thomas…a British-Canadian musician, singer/songwriter…who passed from our sight on Thursday. The song is from 1968…which I find hard to believe…and peaked at No. 2 on Billboard Hot 100 in 1969. That band and the tune should be instantly recognizable — and the link to it is here. Of course there’s a bass cover to this — and that’s linked here.
Today’s classical ‘blast from the past’ was preordained this past Sunday…as it was the summer solstice in the northern hemisphere. In celebration of that event, here’s Antoni Vivaldi’s Violin Concerto No. 2 in G minor, Op. 8 — and performed to perfection by the San Francisco-based ‘Voices of Music’. The link is here.
Both silver and closed well off their respective low ticks of the day…silver in particular. All the large traders holding July futures contracts — and not standing for delivery that month, had to roll or sell them by the COMEX close on Friday. All the rest have to be out by the COMEX close on Monday — and the First Day Notice numbers for the July delivery month will be in Tuesday’s missive.
‘Da boyz’ were particularly hard on silver…it being their No. 1 problem child — and going into the scheduled July delivery month, they wanted to blow out as many longs as possible from the Managed Money traders et al.
categories. How successful they is debatable…especially considering how badly the Big 8 commercial traders got stuffed in Friday’s COT Report.
Net volume in gold were barely above fumes & vapours — and net silver volume was fumes & vapours. Total open interest in gold rose by an insignificant amount — and in silver total o.i. increase by a bit more than that. But because it’s the roll out of the July contract…I’m not prepared to read anything into these numbers. Total open interest in both remain just off their record 17-year lows.
After their rallies on Thursday and Friday, both silver and gold are now back above oversold on their respective RSI traces.
Despite the gains in both platinum and palladium, they remains eye-watering amounts below their respective 200-day moving averages. Despite that fact, the Managed Money traders remain net long platinum by a very decent amount…as are the traders in the Other Reportables and Nonreportable/small traders category. In palladium, these same Managed Money traders are net short against every other category of trader…including all the commercial traders. You couldn’t make this stuff up.
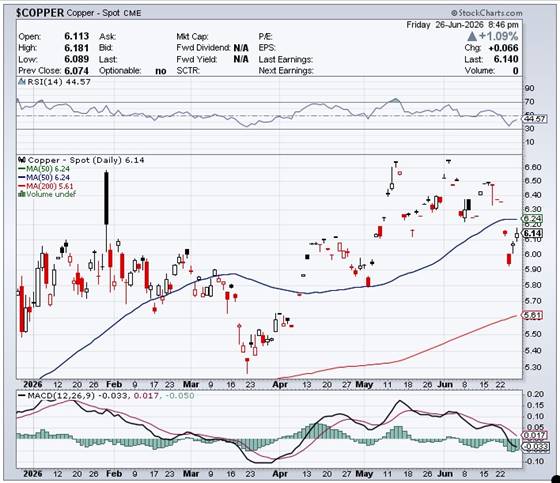
Copper also closed higher for the second day in a row…it by 6.6 cents at $6.14/ pound — and still some distance below its 50-day moving average.
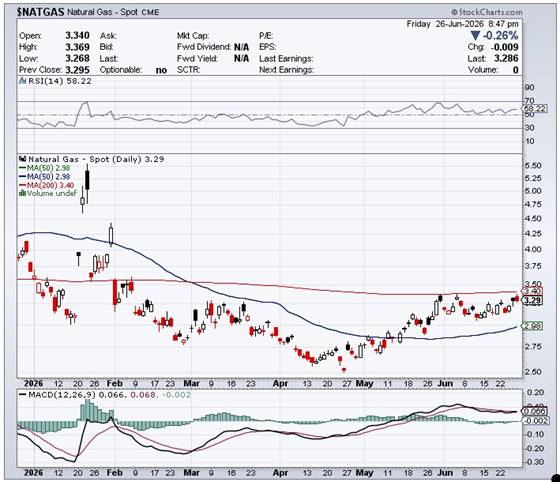
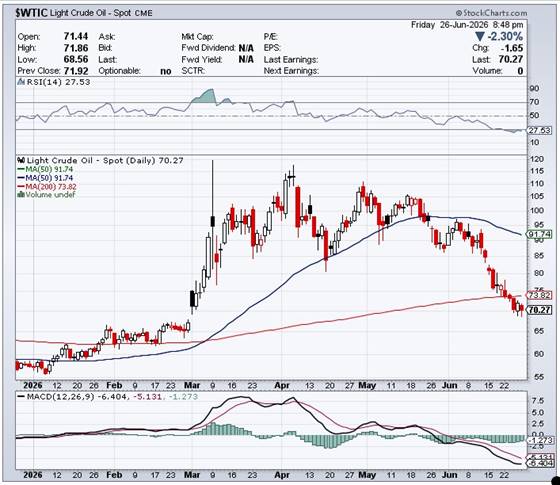
Both natural gas [chart included] and WTIC were closed down on the day… natural gas by 0.009 cents at $3.286/1,000 cubic feet — and WTIC by $1.65 …at $70.27/ barrel — and still oversold by a bit on its RSI trace.
Here are the 6-month charts for the Big 6+1 commodities for Friday… thanks to stockcharts.com as always. Click to enlarge.
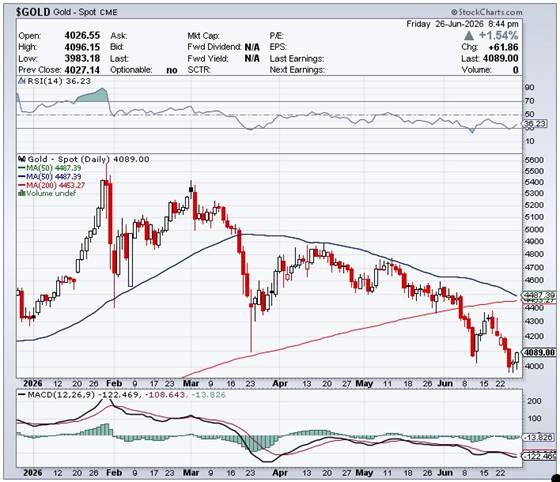
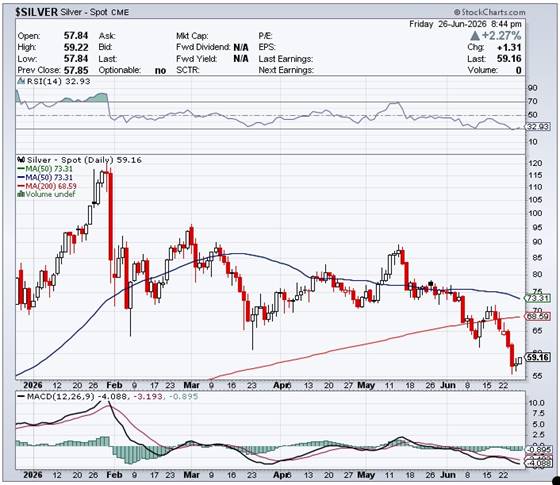
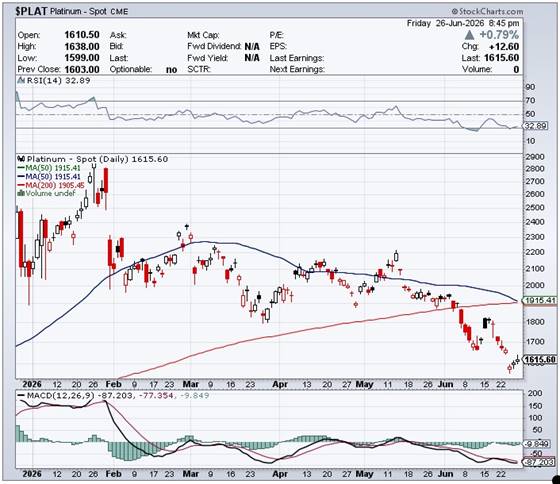
Despite the mother of all clean-out attempts to the downside, it’s safe to say that the collusive commercial shorts…8 in silver, and 10 or 11 in gold…ran face first into the brick wall of diminishing returns again in this COT Report, as the Managed Money traders, et al. refused to follow the Pavlovian script and sell to them. The same can be said of the Big 8 shorts in platinum as well.
Yes, ‘da boyz’ got their prices lower, but it was on only on minuscule volume — and not the monster volume that the commercial traders were hoping to generate…especially considering how far they managed to get these three precious metals below their respective 200-day moving averages.
As I said in my COT commentary further up…”It now stands to reason that a majority of the up-until-now brain dead traders in the Managed Money traders et al. categories are now up to speed on how they’ve been screwed over for the last many decades — and their refusal to sell is a big ‘up yours’ to ‘da boyz’. Good on ’em!”
Of course it’s always possible that the brain-dead variety of Managed Money traders et al. have already sold — and those remaining are a new breed…more than aware of how these ‘wash, rinse & spin’ cycle work — and are standing their ground…just waiting for the guaranteed ensuing rally that will begin when it’s allowed.
I mentioned further up how well the silver equities are ‘outperforming’, relative to its underlying precious metal…compared to the HUI and the gold price. It appears likely that there must be some stealth accumulation of shares in the silver miners — and whoever they may be, must have pretty deep pockets…as the dichotomy between the performance of the gold stocks vs. the silver shares is very stark.
The Big 8 commercial shorts in silver are about 1,600 contracts worse off than they were back on April 7 when silver was $14 higher than it is now — and 18,000 contracts worse off in gold than they were on May 26, when gold was $400 higher than it was at Friday’s close. Those two dates were the low water marks for the Big 8 commercial shorts in those two precious metals.
With the Managed Money traders basically saying no mas for the last several months…culminating in Friday’s ‘up yours’…the second time in three weeks…I don’t like the chances of the collusive commercial traders being able to reduce their short positions any further.
While the collusive commercial shorts in the COMEX future market contemplate their futures, there are many other pieces in motion on the precious metals chessboard.
The talk of a U.S. 50-year bond, redeemable in gold…to be announced on July 4…is still floating around out there — and not only refuses to go away, the commentary on it is increasing. I’m skeptical myself…as are others…but you just never know.
Then there’s the eye-popping price tag for the limited U.S. mintage of the ‘Freedom Ringing – Liberty Bell Gold Coins and Silver Medals’. The 1-ounce gold is $19,600 — and the half-ounce is $10,050. And dare I mentioned the price of the 1-ounce and half-ounce silver Liberty Bells…$1,500 and $750 respectively.
But the big kahuna continues to be the $10,000 to $20,000 December call options in gold…which first came to my attention in early March. Reader Brian Goodner sent me a couple of ‘X‘ posts about it earlier this week…the latest one from yesterday is linked here.
To quote @IntlStacker: Something very unusual is happening in CME Gold Options:
*$10,000 Call → 11,757 Open Interest!
*$15,000 Call → 27,348 Open Interest
*$20,000 Call → 30,021 Open Interest
Total open interest in all of these has risen substantially since I reported on them last about a month ago.
As @MBAeconmics added to the above thread: Today let us celebrate the #Comex December expiration $20,000 strike gold call option open interest surpassing 30,000 contracts. You are living through history ladies and gentlemen!
And quietly over in China, was this news item from the South China Morning Post headlined “Major Chinese banks suspend individual trading on Shanghai Gold Exchange amid volatility” that appeared in my Friday missive — and linked again here.
In commentary on the goldmoney.com Internet site on Thursday, Alasdair Macleod posted an article with the excellent headline… “Last growl of the PM bear?” where he mentioned the possible significance of that SCMP story…
“China realises that she must bring gold trading for her yuan closer to home and beyond the control of the U.S. and other G7 governments. It would be naïve of us to think that China won’t apply similar methods, but from her actions it is clear that she intends to use gold to secure the value of her own currency by turning it into a gold substitute. She can do that at a time of her choosing, but when she does the entire fiat currency system will be exposed as a sham and face collapse.
It appears that the word is out to China’s large banks. China Construction Bank is closing its customer trading facilities for gold and silver on the Shanghai Gold Exchange from July 24th and ICBC made a similar announcement for the same date: “it would close agency personal auction trading through mobile banking, online banking. After the closure the closing selling and delivery operations of customers holding positions will be restricted”.
Coupled with Chinese banks reducing transaction fees to 0.2% on their customers’ gold accumulation accounts, these moves are clearly aimed at reducing speculation and encouraging accumulation. The common date of 24th July suggests an event is in the wings. What that will be we can only guess.
Timing is of the essence. If she acts too soon China will be blamed for creating all our woes. She might decide to wait until it is obvious that she acts to protect herself from the collapse in our fiat currencies which are entirely our responsibility. It seems unlikely that 24th July will see the yuan fixed to gold. Could it be a revelation of how many tonnes China has actually accumulated off-balance sheet over the last 40 years, as a first step to a yuan gold standard?
Whatever it is, the message from China’s establishment banks to its customers is…don’t be short!”
Yes…sage advice indeed — and something that Ted Butler pointed out almost three year ago in his landmark commentary headlined “The Bonfire of the Silver Shorts.”
So…along with “all of the above” — and the setup in the precious metals in the COMEX futures market the most white-hot bullish on record…we wait some more.
I’m still “all in” — and, as always, will remain so to whatever end.
See you here on Tuesday.
Ed


