Gold, Silver and Copper Downside Targets Following Break Lower…

Not much has been written about the Precious Metals sector in the recent past on the site for the simple reason that an intermediate corrective downtrend is in force that started to reassert itself in a big way on Friday and as Precious Metals stocks tend to move like a flock of sheep, so that when the sector drops most stocks drop pretty much regardless of their fundamentals, it therefore makes sense to bide our time and move in and buy in a more determined manner when it looks like the correction has run its course. The good news is that the drop now started should quickly take the sector down to our target area, where we plan to buy across the board, and the sector is expected to bottom before the broad market hits bottom, as usual, and we should keep that in mind going forward. We will take a look at the updated charts for the broad market S&P500 index and Nasdaq Composite index in another article.
So now we’ll run through the charts, and this article is the logical sequel to the article GOLD SILVER & COPPER – DOWNSIDE TARGETS posted on the site on 24th May, where a breakdown by the Precious Metals sector into another steep drop was predicted. For ease of comparison with the earlier article (and less work), we’ll use mostly the same charts, updated.
Gold’s 6-month chart shows how the sharp drop this past Friday caused it to break down below its 200-day moving average for the 1st time since the Fall of 2023, when it was in a trading range. This was a bearish development especially as its parabolic uptrend also failed (see 5-year chart below) and it opens the door to a further drop to our downside target in the strong support in the $3500 zone that could happen quickly in the event of a pan selloff which is where this intermediate correction within the ongoing bull market is expected to end (ahead of any final low in the broad stock market) and which will therefore be viewed as a major buying opportunity.
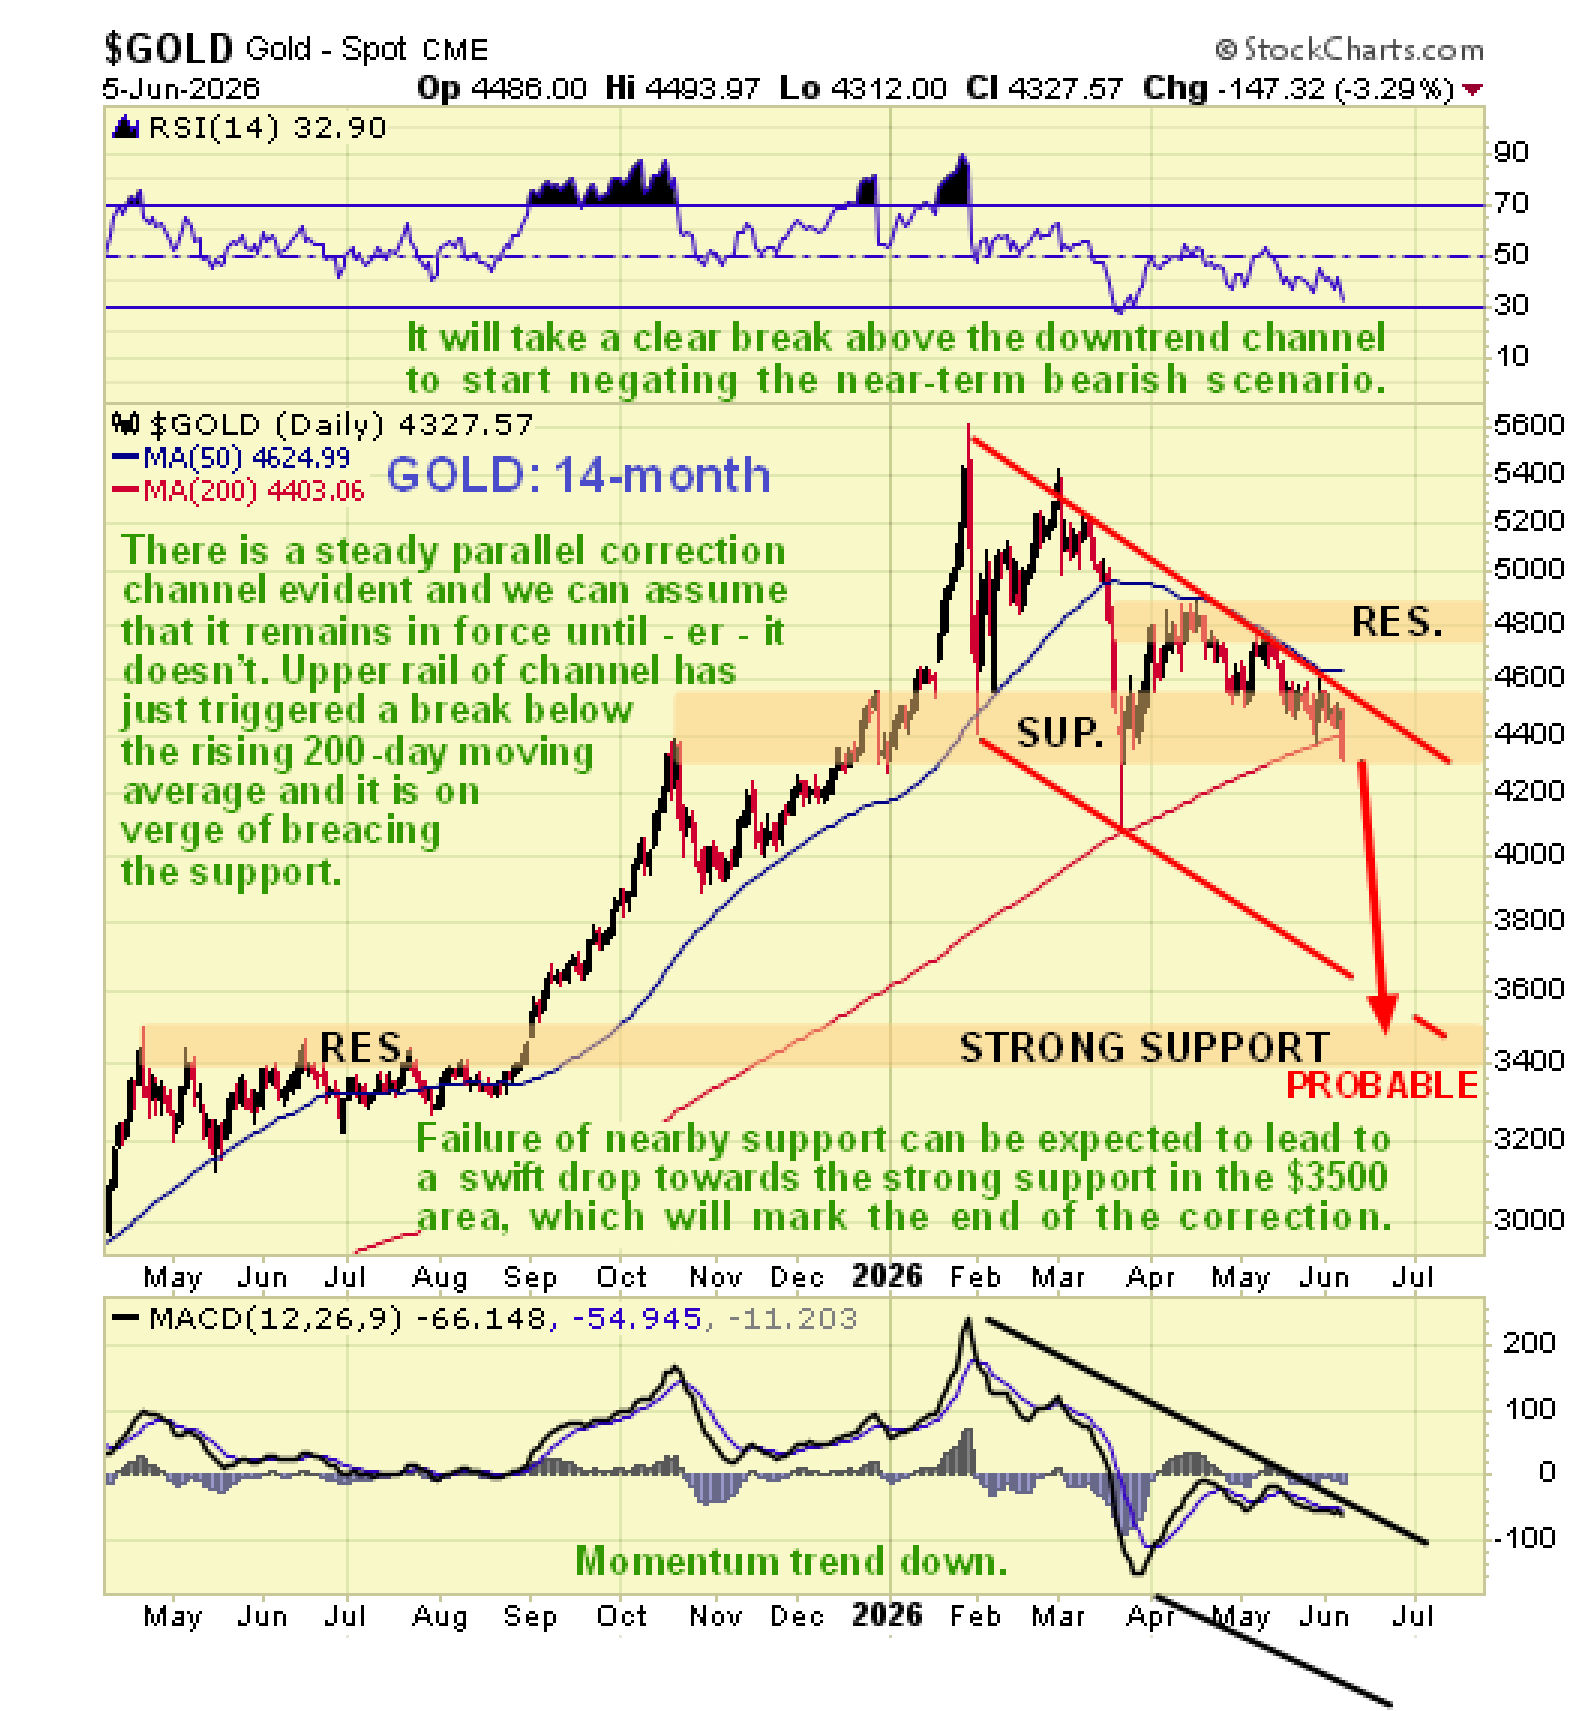
The 14-month gold chart looks quite ominous for the short to medium-term for on it we can clearly see how the intermediate corrective downtrend remains very much in force and how it emphatically reasserted itself on Friday with the upper rail of the channel forcing a breakdown beneath the rising 200-day moving average for the 1st time since 2023 when gold was still rangebound. This setup projects a hefty drop to the strong support in the $3500 area arising from a long period of trading in the large Ascending Triangle that preceded the August 2025 breakout into the big runup and such a drop will obviously be made much more likely by a pan selloff across markets that action elsewhere, particularly in the Tech sector, suggests may be imminent.
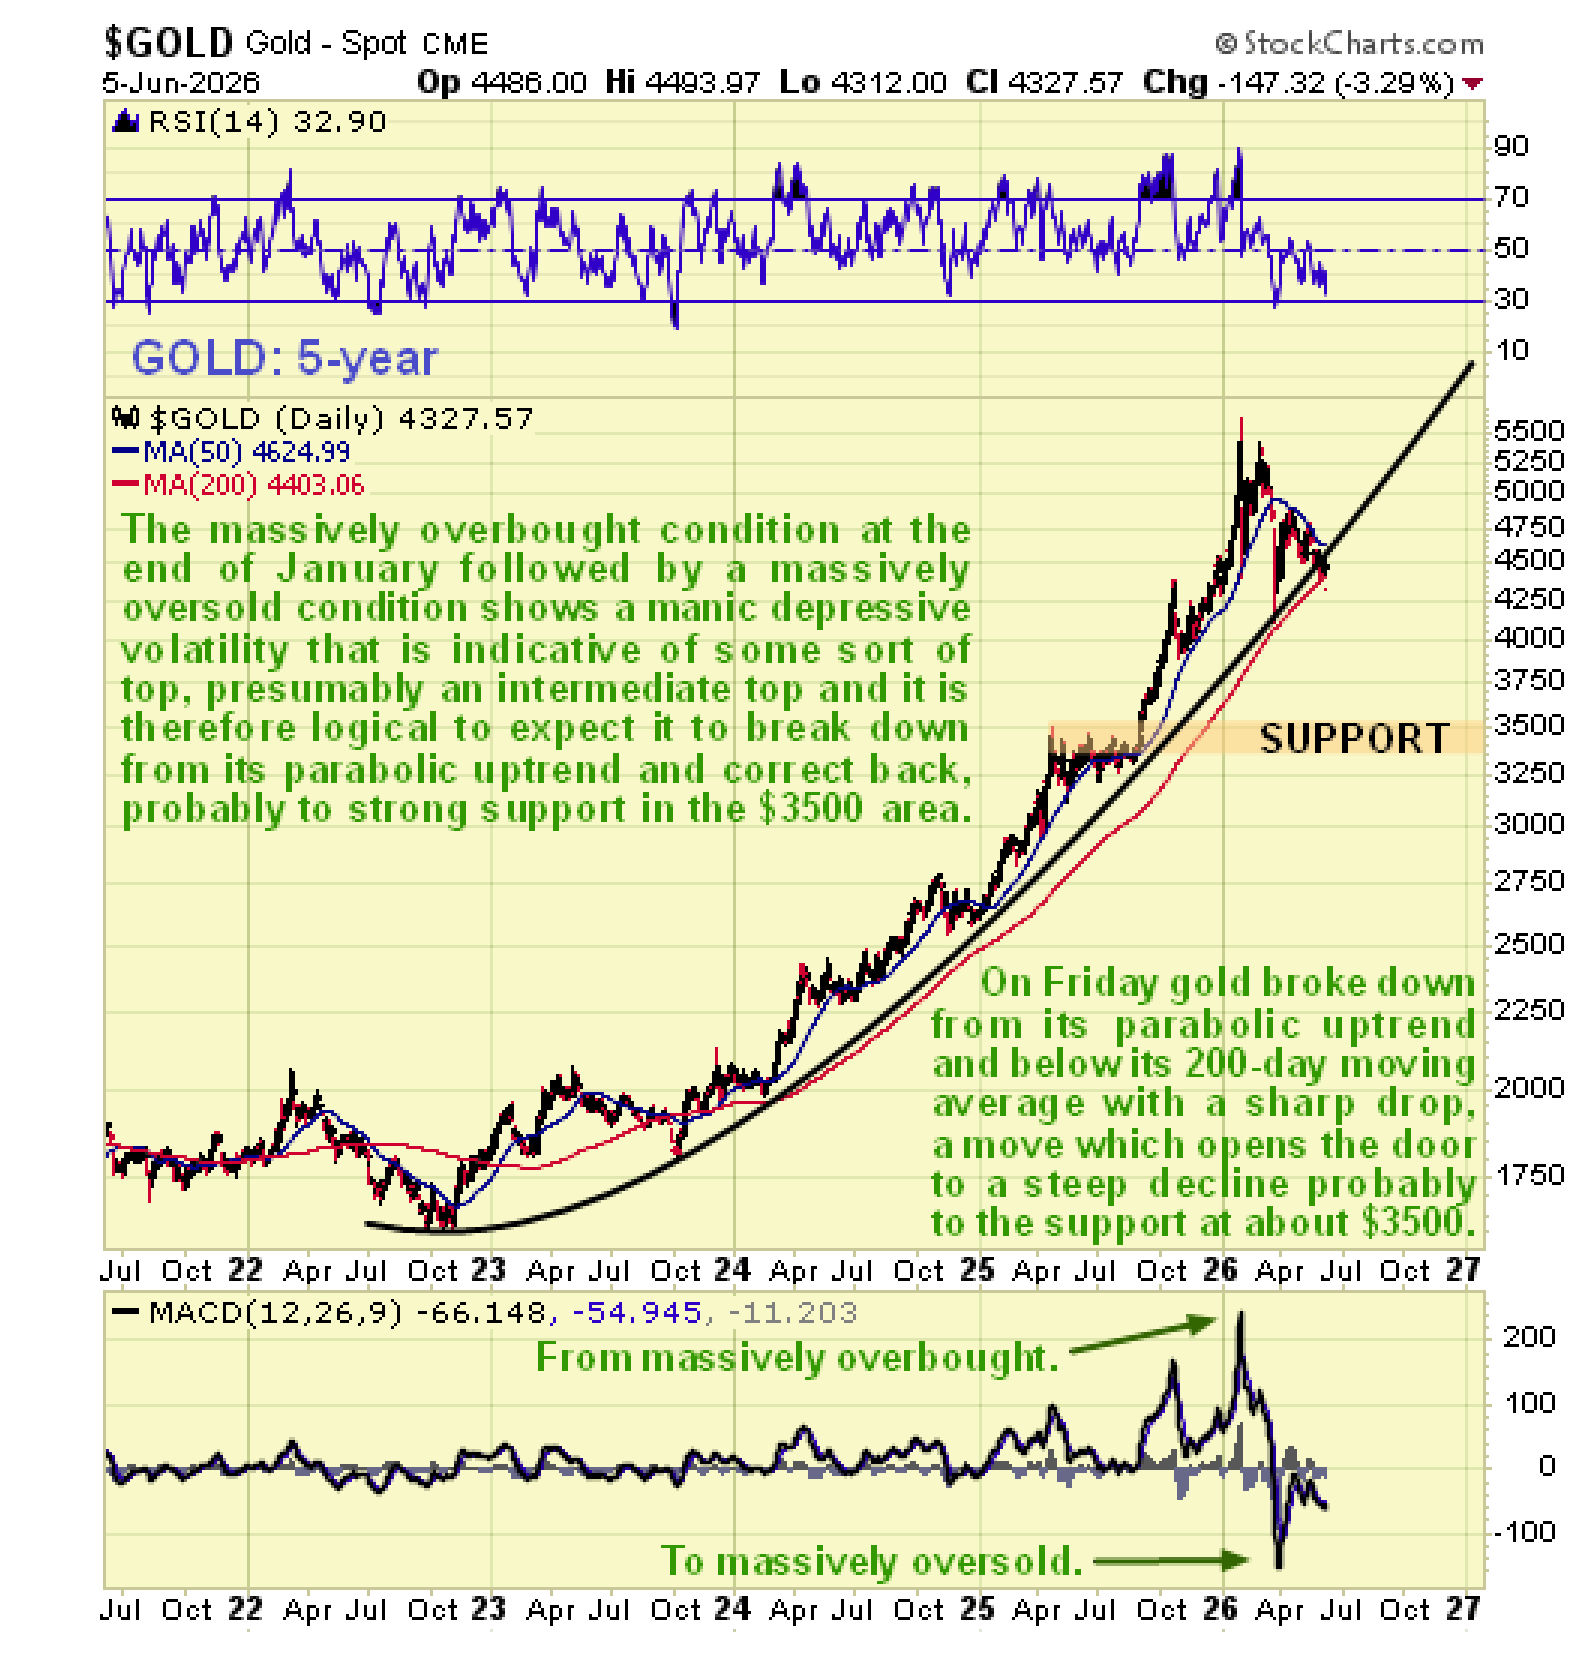
 On gold’s 5-year chart, we can see that not only did gold break below its rising 200-day moving average this past Friday, but it also broke down from its parabolic uptrend that had been in force from as far back as 2022. As pointed out in the article GOLD SILVER & COPPER – DOWNSIDE TARGETS posted on the site on 24th, this parabolic uptrend had become very steep, which made the probability that gold would break down from its soon high, especially given the wild volatility shown by the MACD indicator that was characteristic of some sort of top, again as previously noted.
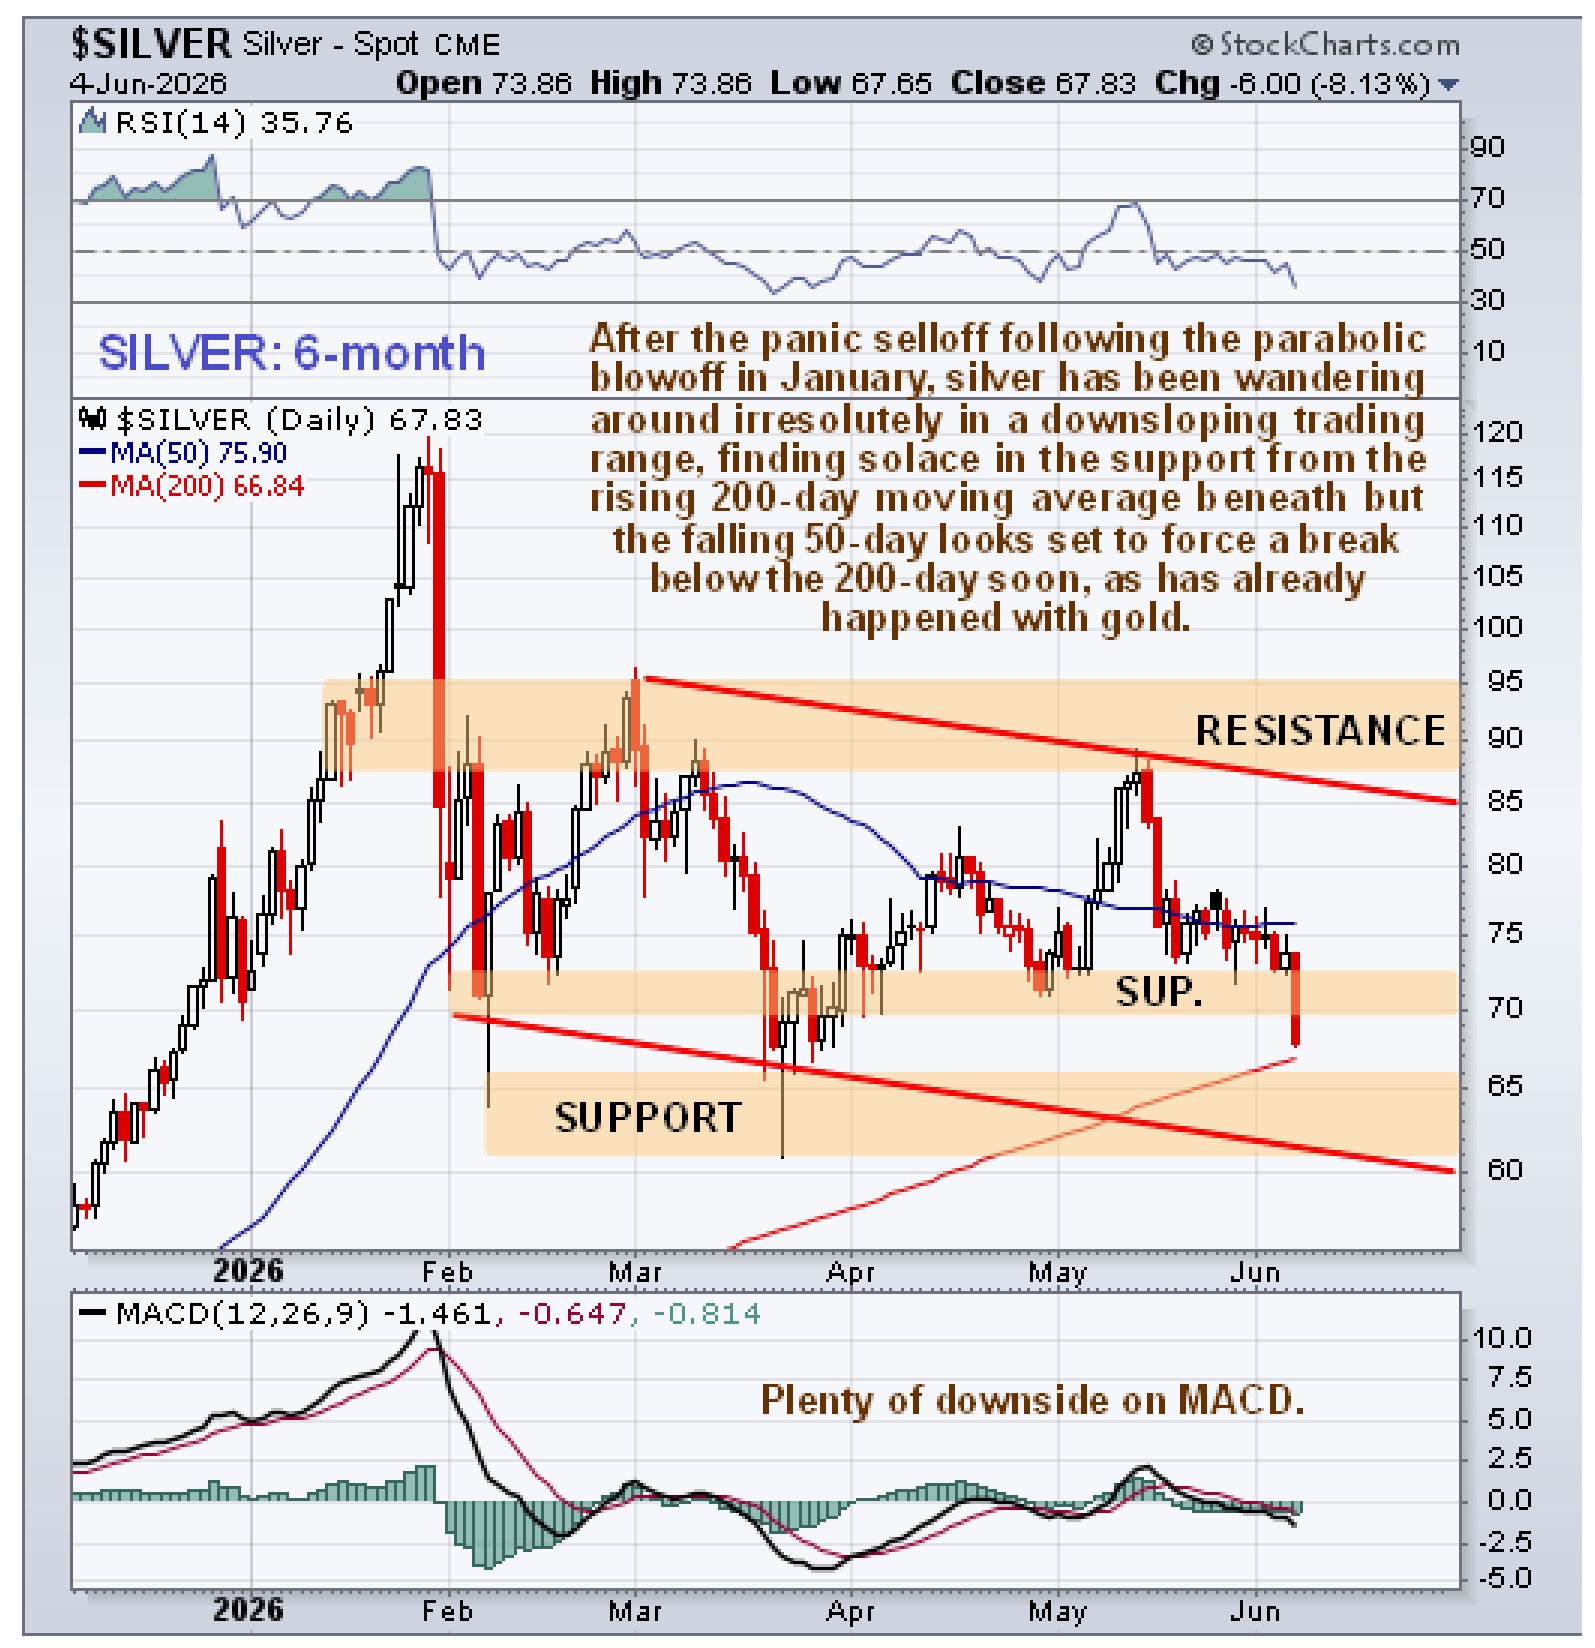
 Turning to silver, the situation is similar to gold so we won’t need to say too much about it, other than point out the important differences. On its 6-month chart, we can see the rude break below nearby support on Friday with a sharp drop, and even though it still hasn’t broken below its 200-day moving average yet, the falling 50-day looks set to force a break below it soon, especially as gold’s 200-day has already failed for the first time since the Fall of 2023.
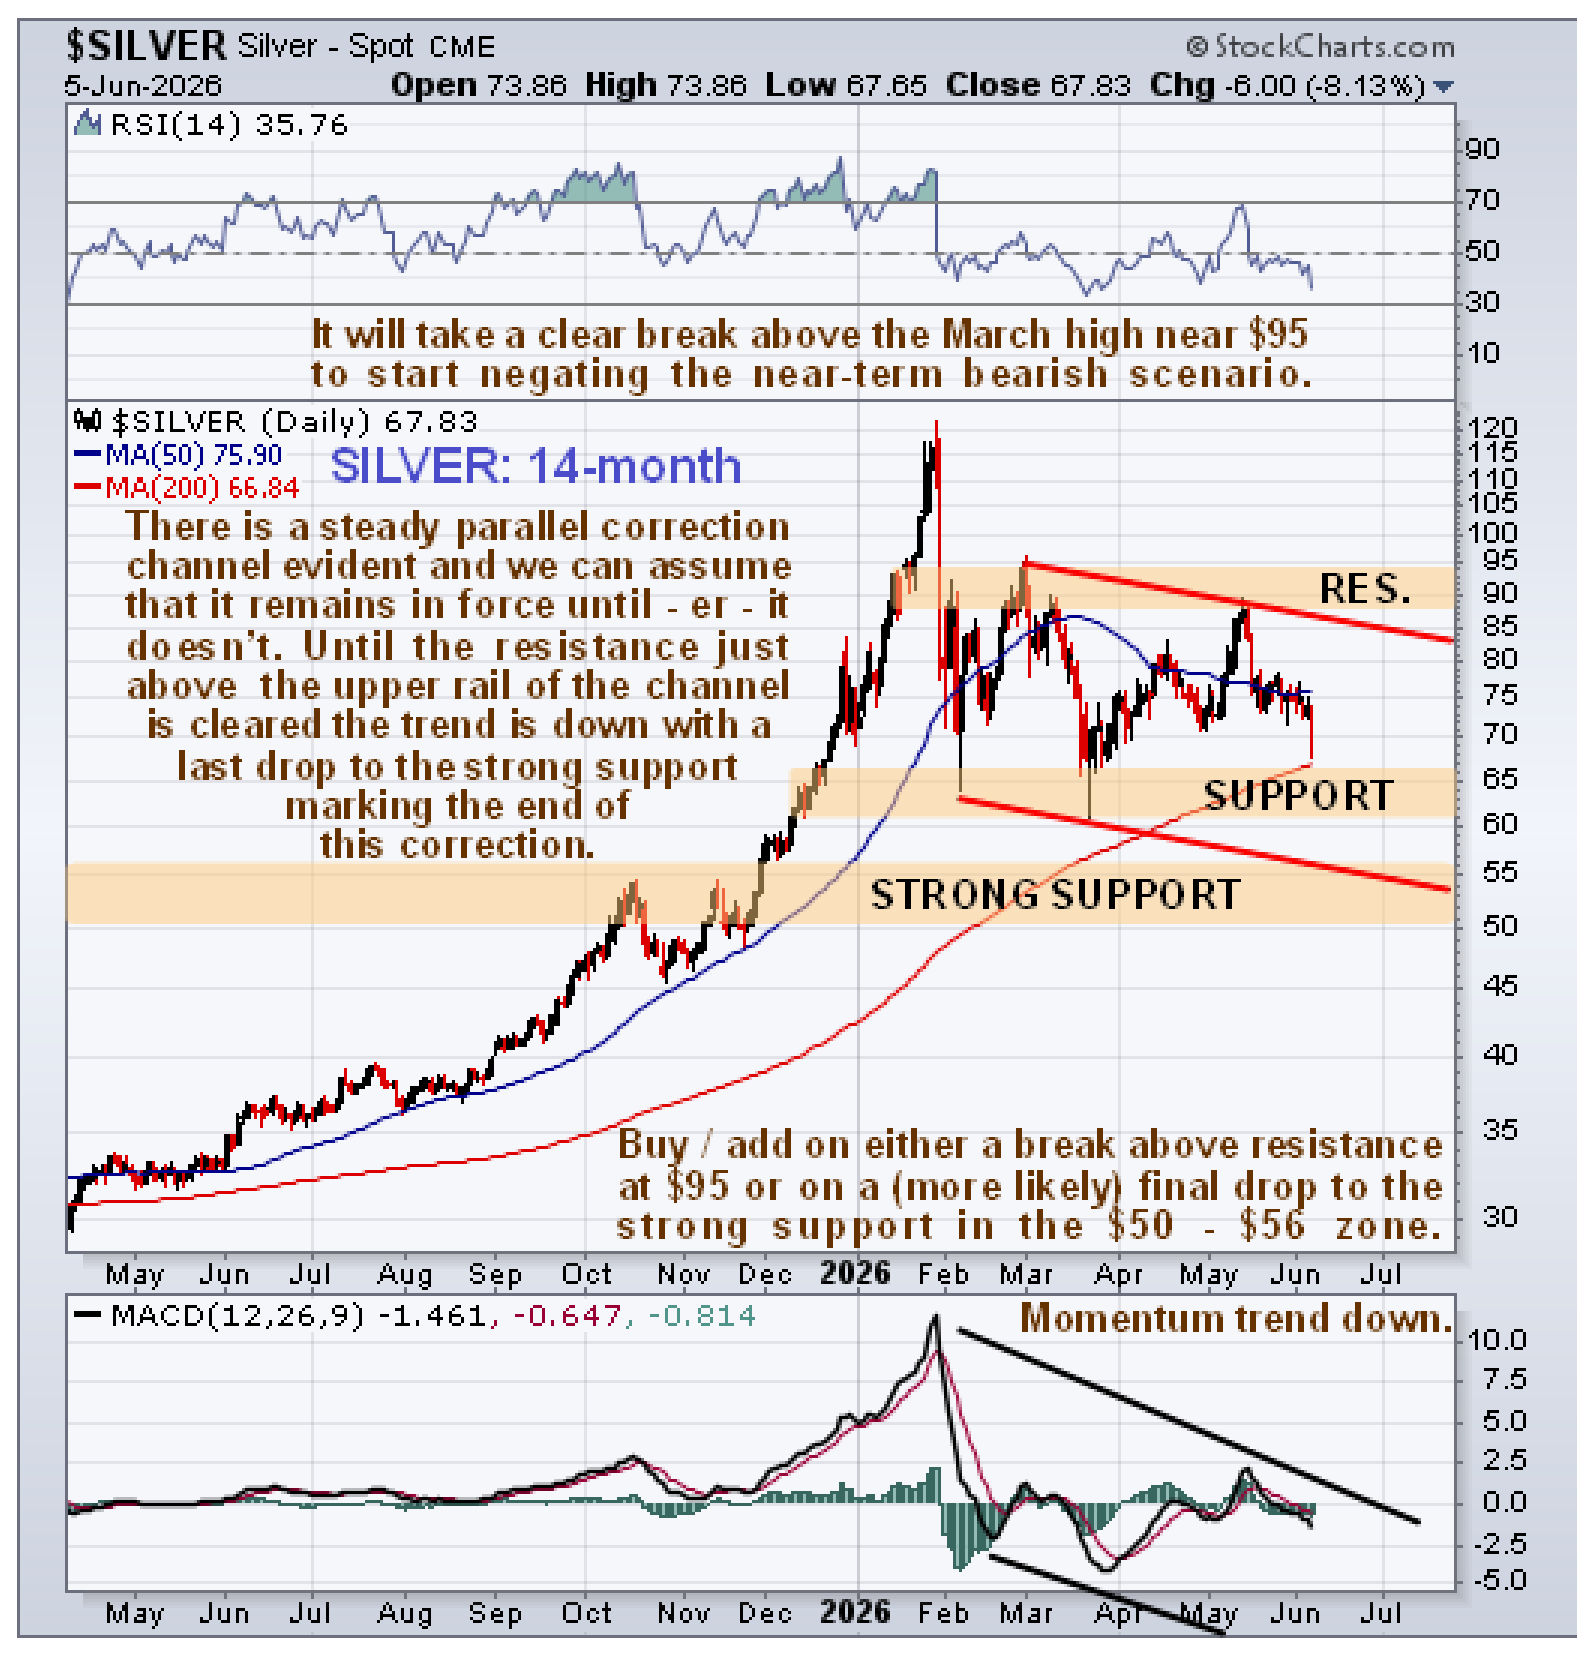
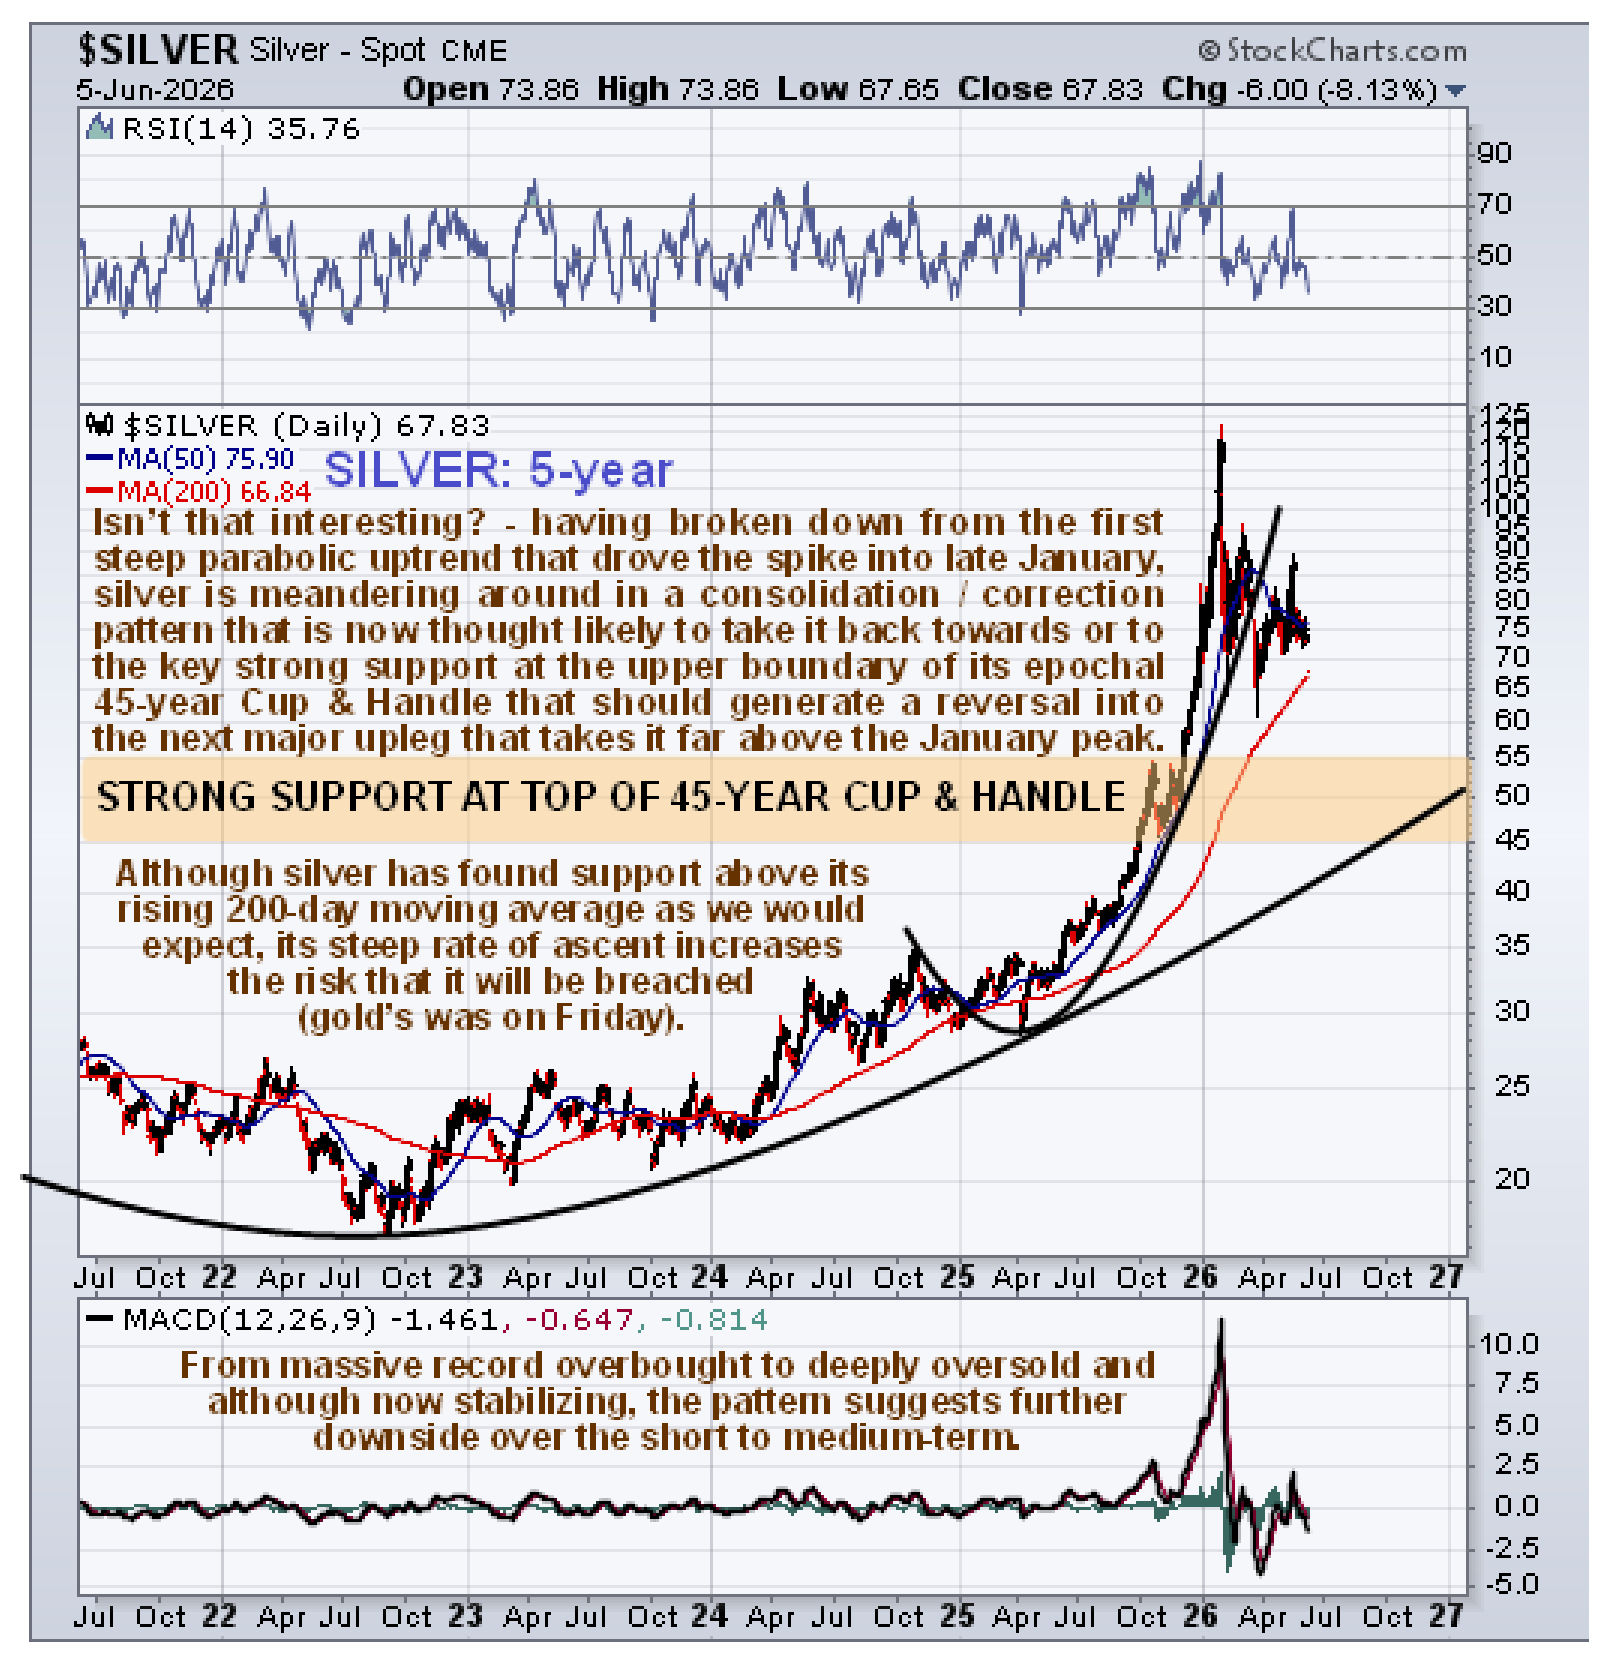
 On silver’s 14-month chart, we get more perspective and see that after the initial panic selloff following its parabolic blowoff top at the end of January, it has been zig-zagging around in a downsloping trading range, finding support above its rising 200-day moving average. A difference with gold is that it hasn’t – yet – broken down below this average, but it dropped hard this past Friday and looks like it soon will and in adverse conditions it will probably break below the nearby support in the $61 – $66 zone and head down to the lower rail of its broad intermediate downtrend channel and the really strong support in the $50 – $55 zone arising from the upper boundary of the giant 45-year Cup & Handle pattern that we have looked at on so many occasions. There, the correction is expected to end, especially as the PM sector tends to bottom ahead of the broad market when pan selloffs occur. This zone is therefore considered to be an excellent point to buy silver investments across the board, and we will be ready.
 The 5-year chart for silver is most interesting for on it we can see how, having broken down from its steeper parabolic uptrend earlier in the year it has been zig-zagging around in a sort of “no mans land”, finding consolation from the support of the rising 200-day moving average, but because this average is rising at a rate that is believed to be too steep, it looks doomed to break below it, a development that would lead to an abrupt change in sentiment that triggers a rapid decline to our target zone in the $50 – $55 area, and here we should note that it could dip briefly even below this in the event of a broad pan selloff, but would then be expected to bounce back fast. Another big reason that this chart is very interesting is that it shows how the expected drop to our target zone will synchronize with silver dropping back to the lower parabolic uptrend shown which is much less steep than the other one and therefore much more sustainable. This uptrend adds further weight to the argument that $50 – $55 is a major sector buy zone as once the price gets down there and stabilizes, it will be ready for the next major upleg that should take silver comfortably to new highs.
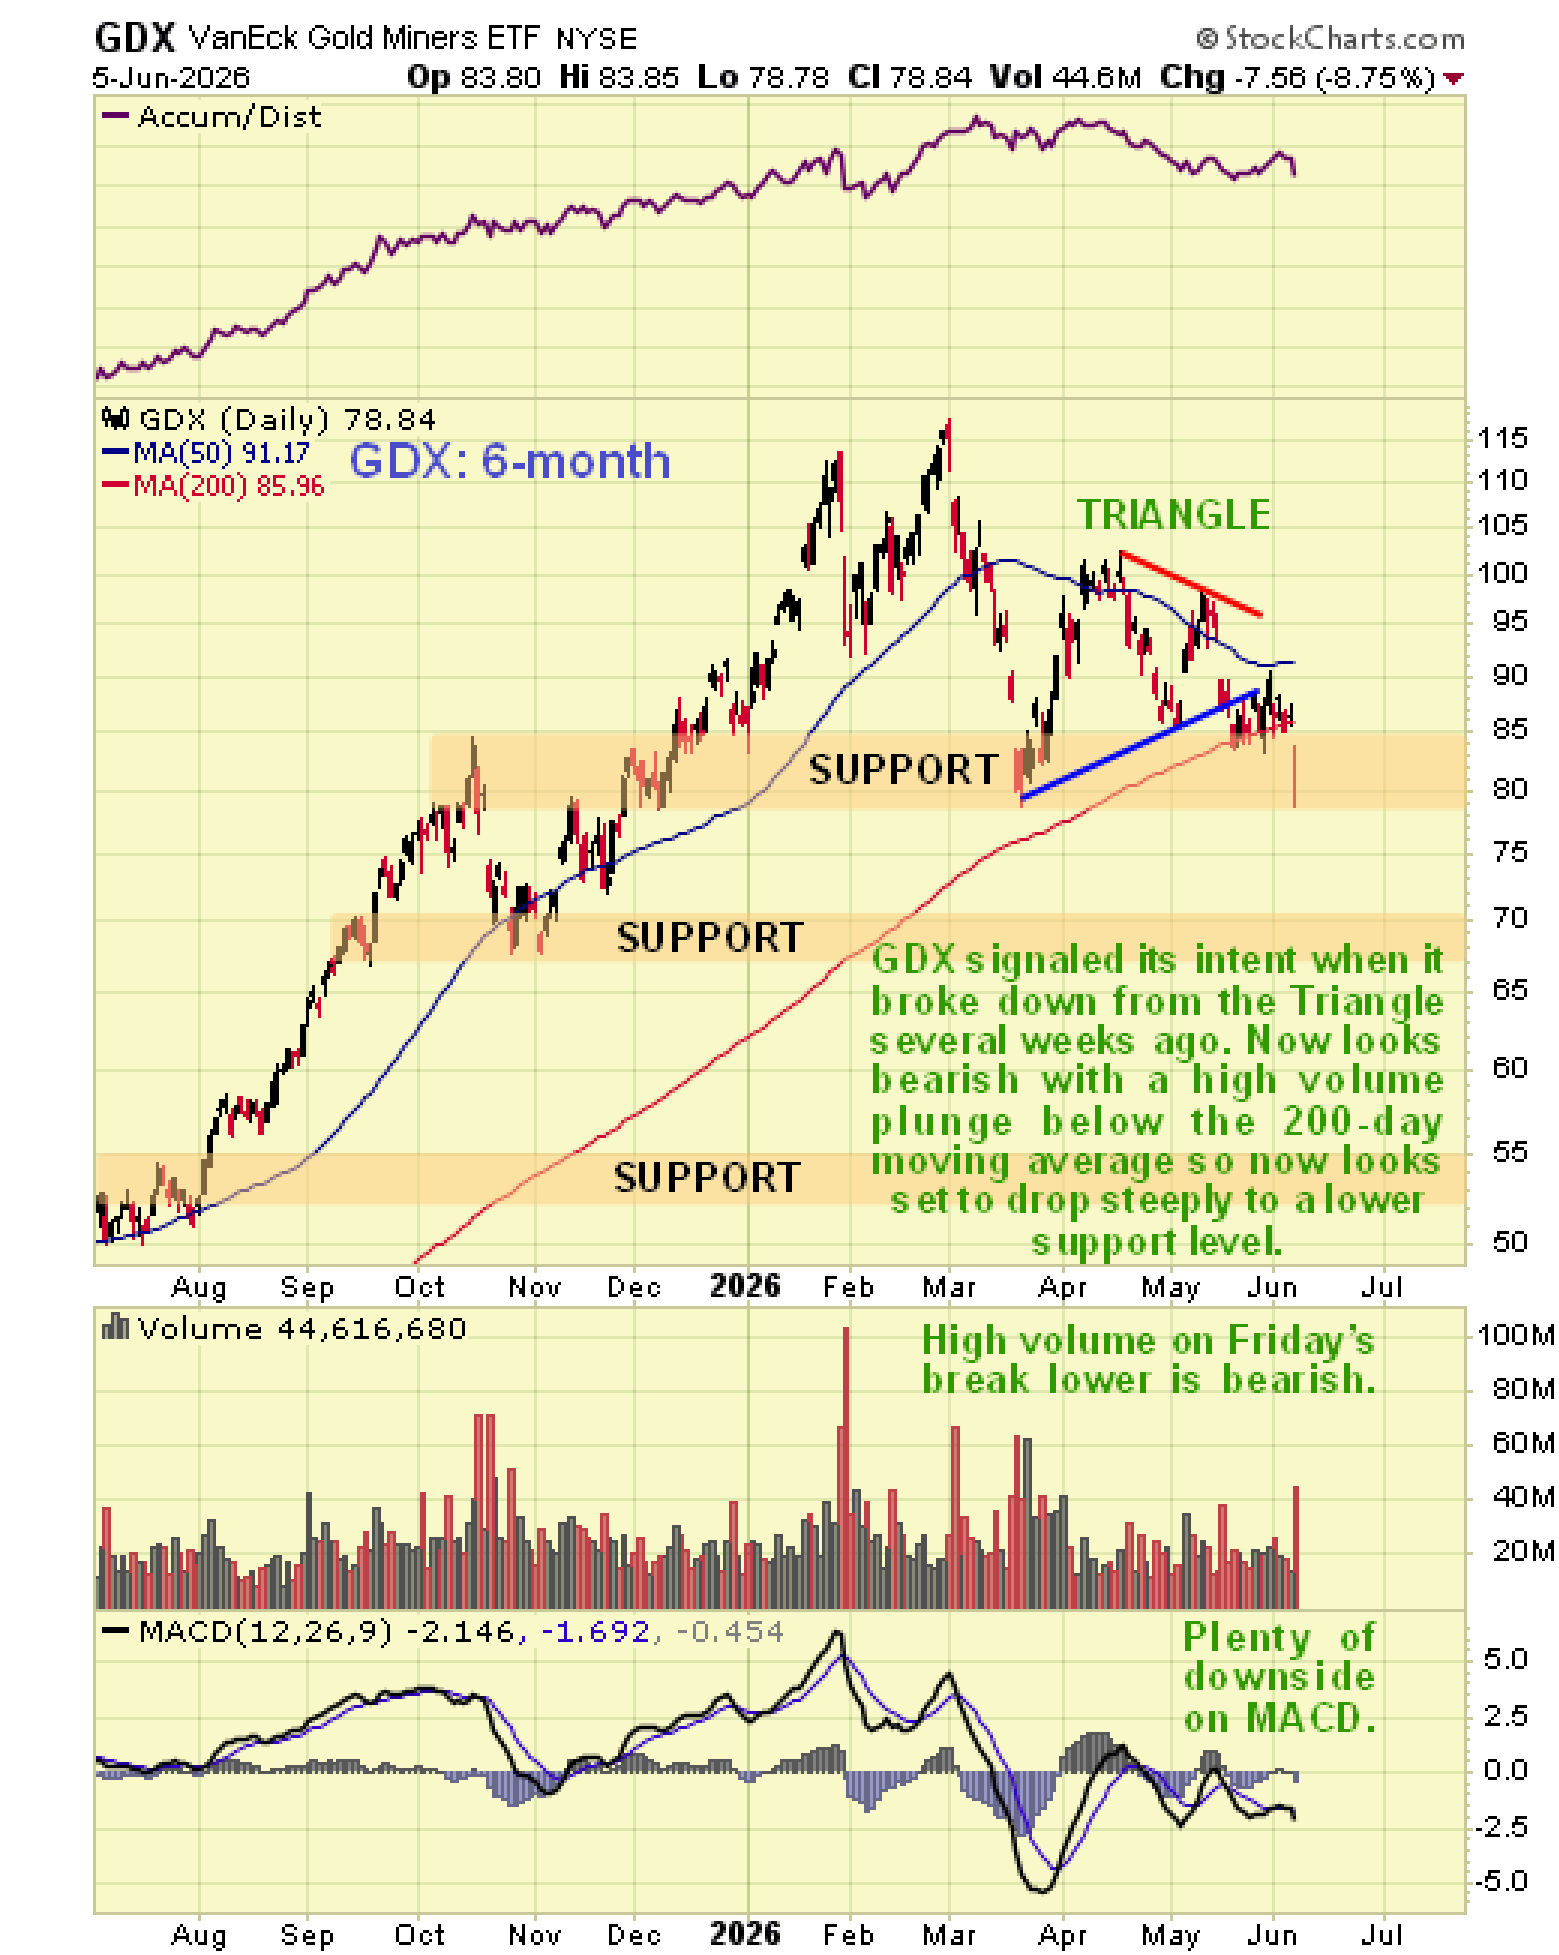
 What about gold stocks? The picture looks bearish over the short to medium-term which of course accords with what we are seeing on the metals charts. On the 6-month chart for GDX we can see that it broke sharply below its 200-day moving average on Friday and is starting to drop away from its recent congestion pattern that took the form of a Symmetrical Triangle. Actually it broke down form this Triangle several weeks ago and then hugged the underside of it in a tight congestion pattern before Friday’s decisive break lower. Now it looks set to drop at least to the 1st support level in the $68 – $70 zone and could head lower in the event that the broad stock market drops hard as is possible now.
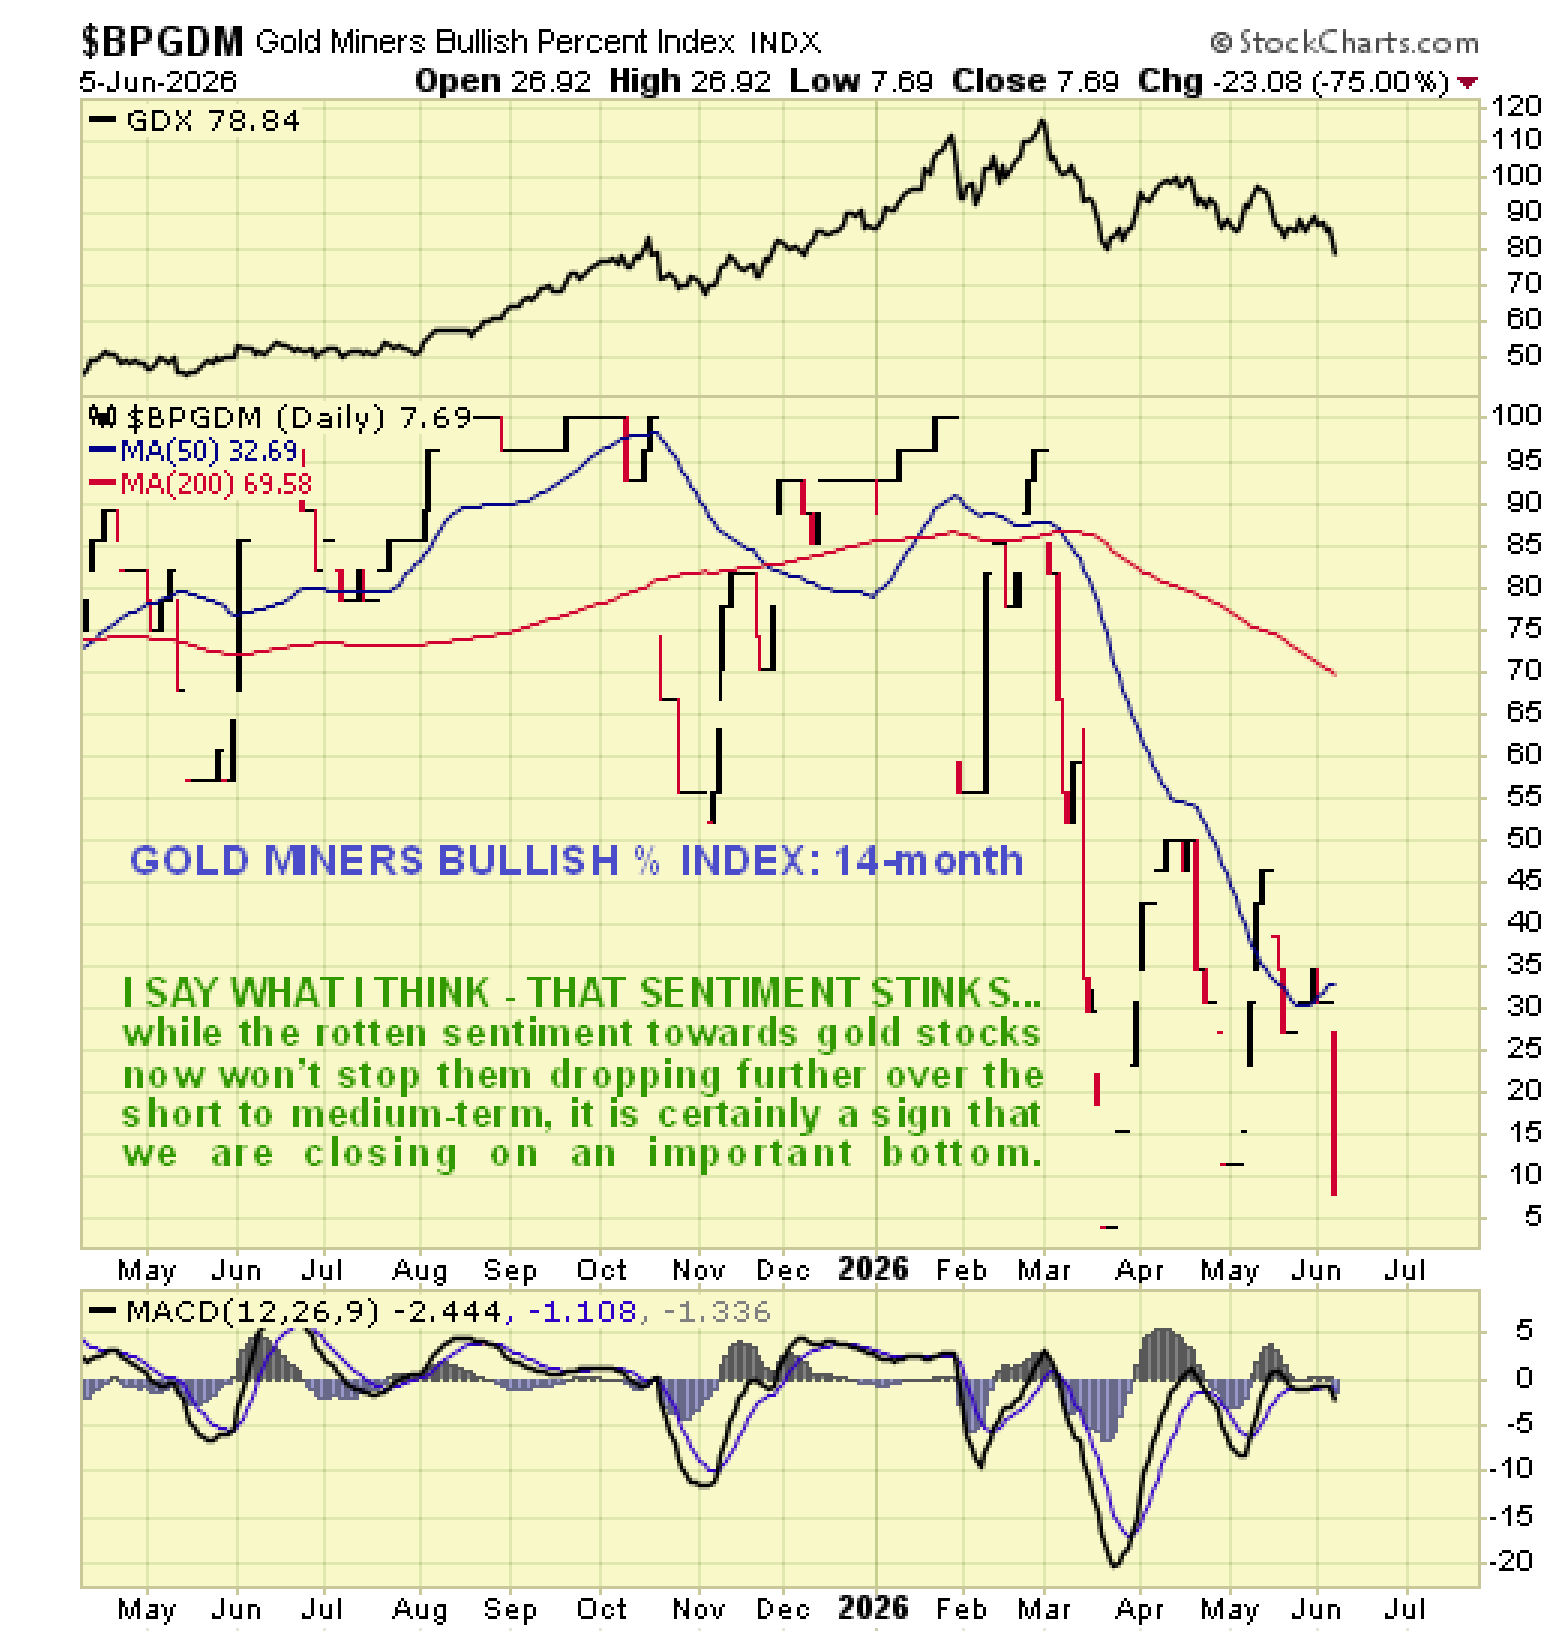
 Not surprisingly, last Friday’s sector plunge saw bullish sentiment towards gold stocks collapse from 30% bullish sometime last week to just 7.7% by Friday’s close. While this won’t stop them dropping over the short to médium-term, and is not expected to, it is taken as a sign that we are approaching an important bottom, so we should keep a close eye on this going forward…
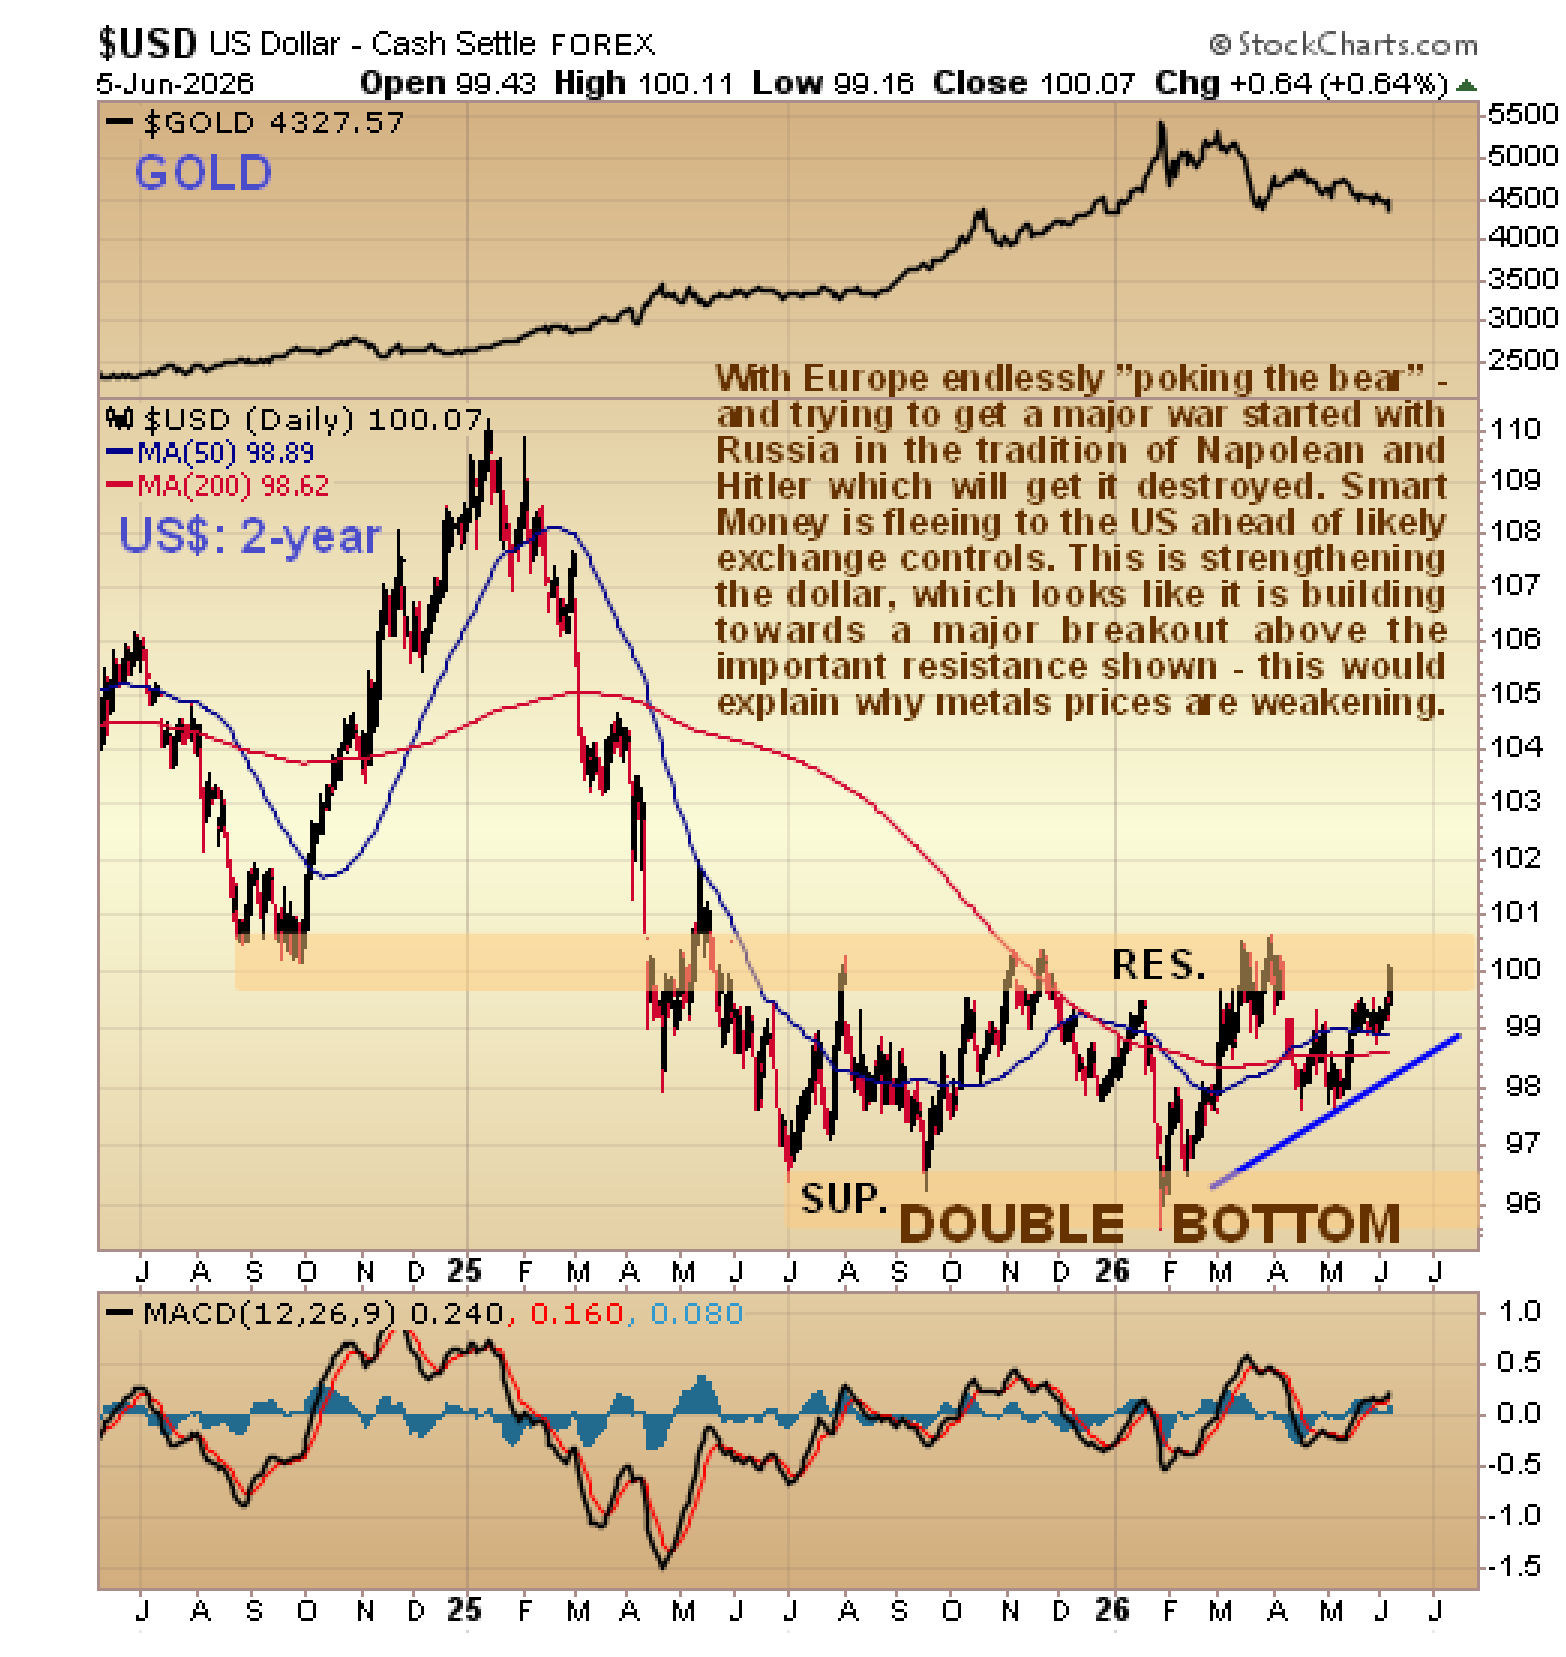
 Meanwhile, the dollar index has been strengthening and looks like it is building up to breaking out above the resistance at the top of a large trading range that has been in progress for over a year. If it succeeds in achieving this, a substantial uptrend is likely to follow. The reason for this development is thought to be at least in part capital flight from Europe (and other unstable places) on a massive scale. Europe is intent on instigating a major war with Russia in the tradition of Napoleon and Hitler (and with the same success) that will probably see it destroyed. So Big Money is fleeing, partly in anticipation of Exchange controls being implemented at some point.
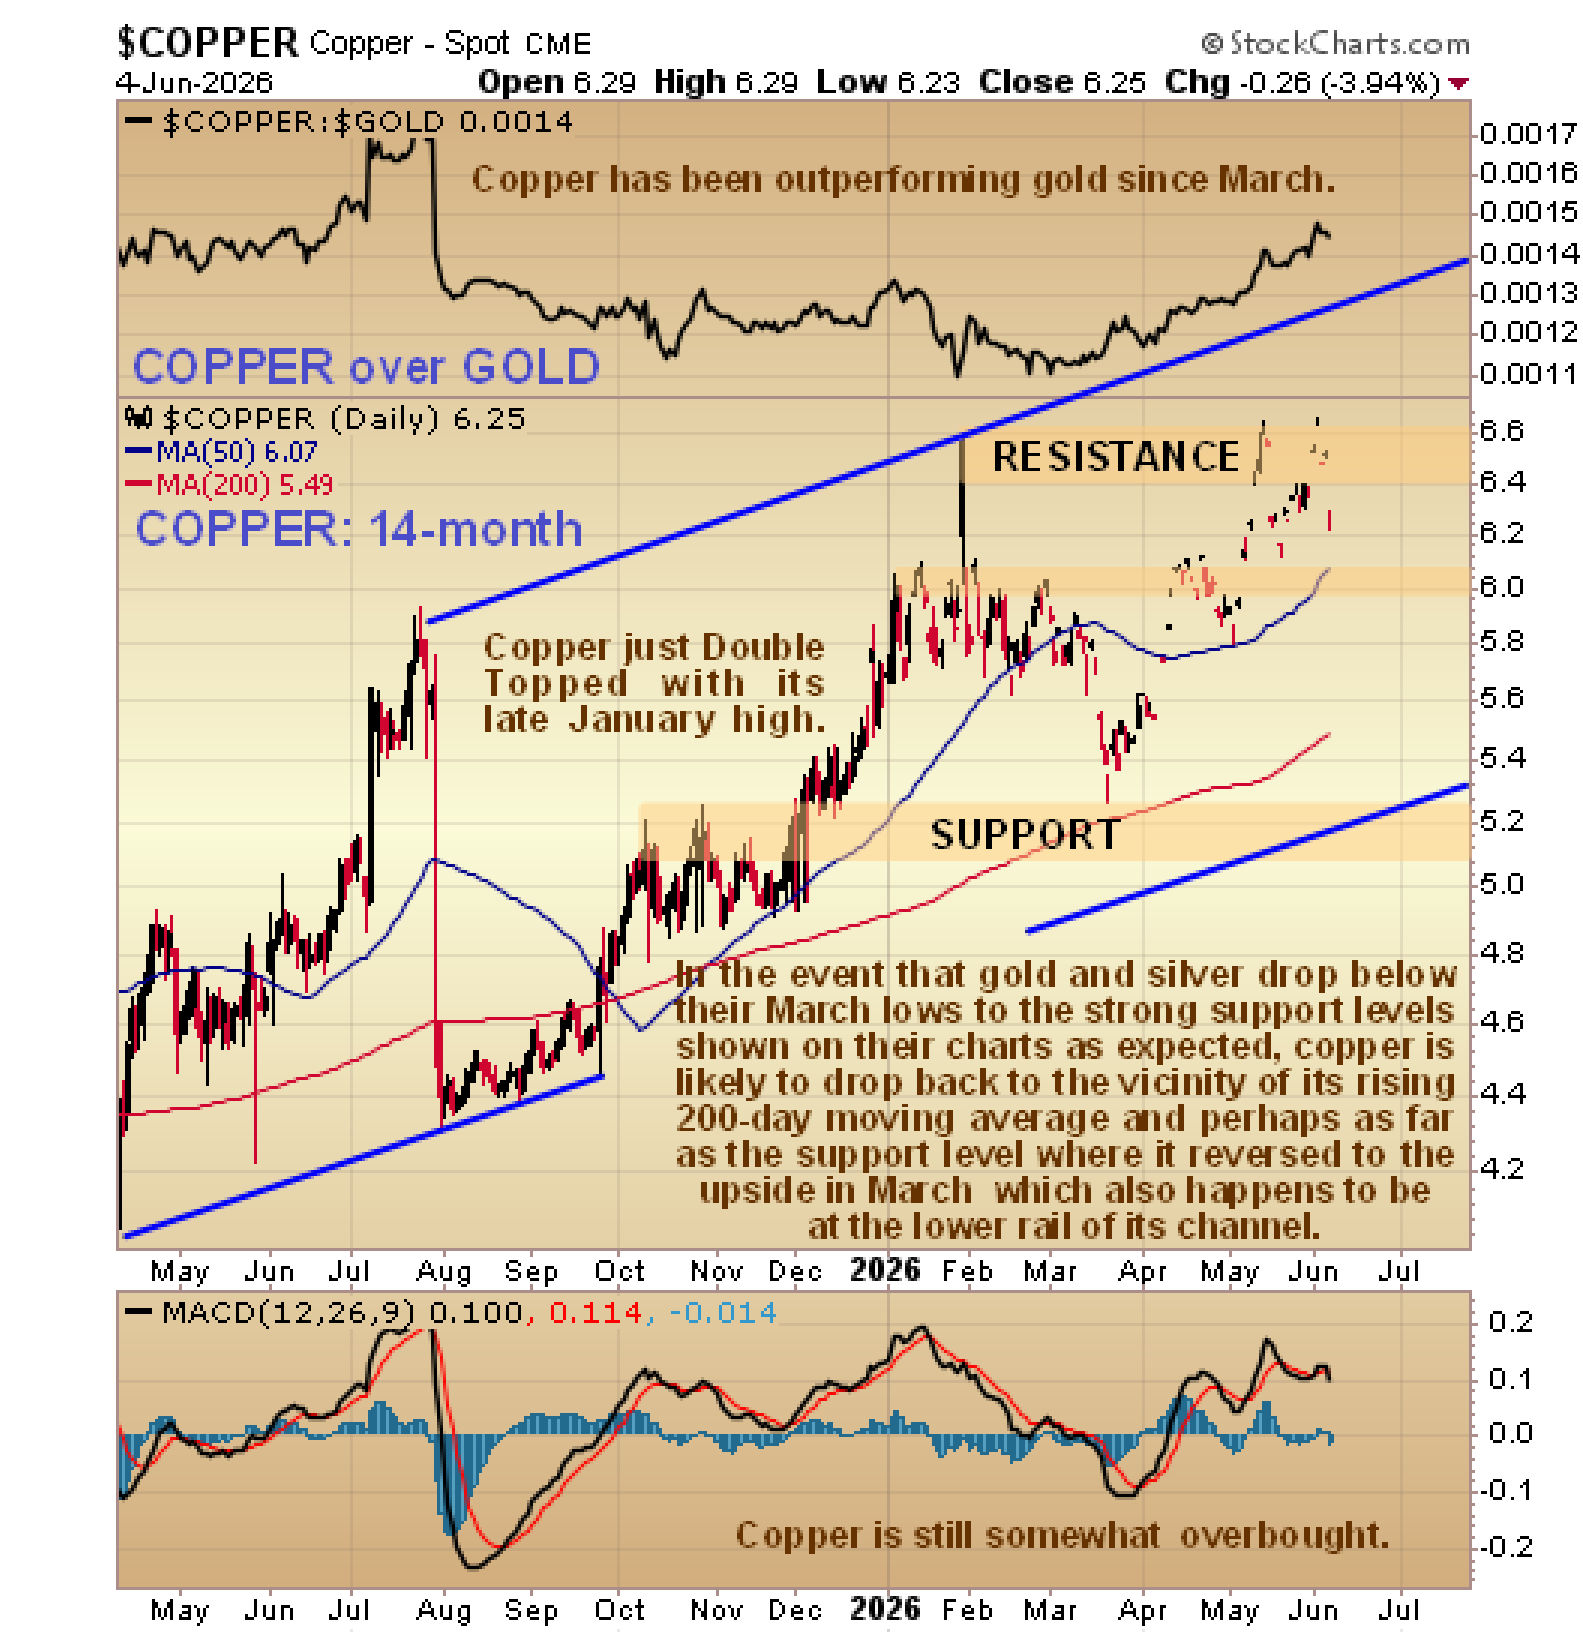
 Now we’ll take a look at copper. On its 14-month chart, we can see that it has been remarkably buoyant in recent weeks, flirting with new highs, and the reason for this is thought to be the huge demand for copper for the countless miles of cabling used in these Data centers that are built out across the US and elsewhere, and also its use in thousands of drones. Nevertheless, it looks set to correct back across its uptrend channel over the short to médium-term in sympathy with the decline in other metals. We earlier had a downside target for it at the support level shown near to $5.20 or a little higher at the lower rail of this uptrend channel, but its recent resilience suggests that it might not drop back that far and instead may react back to the vicinity of its rising 200-day moving average, currently at about $5.50. Over the past couple of weeks, copper appears to have Double Topped with its late January high when it tried to break higher at the worst possible time, right when silver was burning out, but ended the day with an ugly bearish “belt hold line” candle best seen on shorter-term charts.
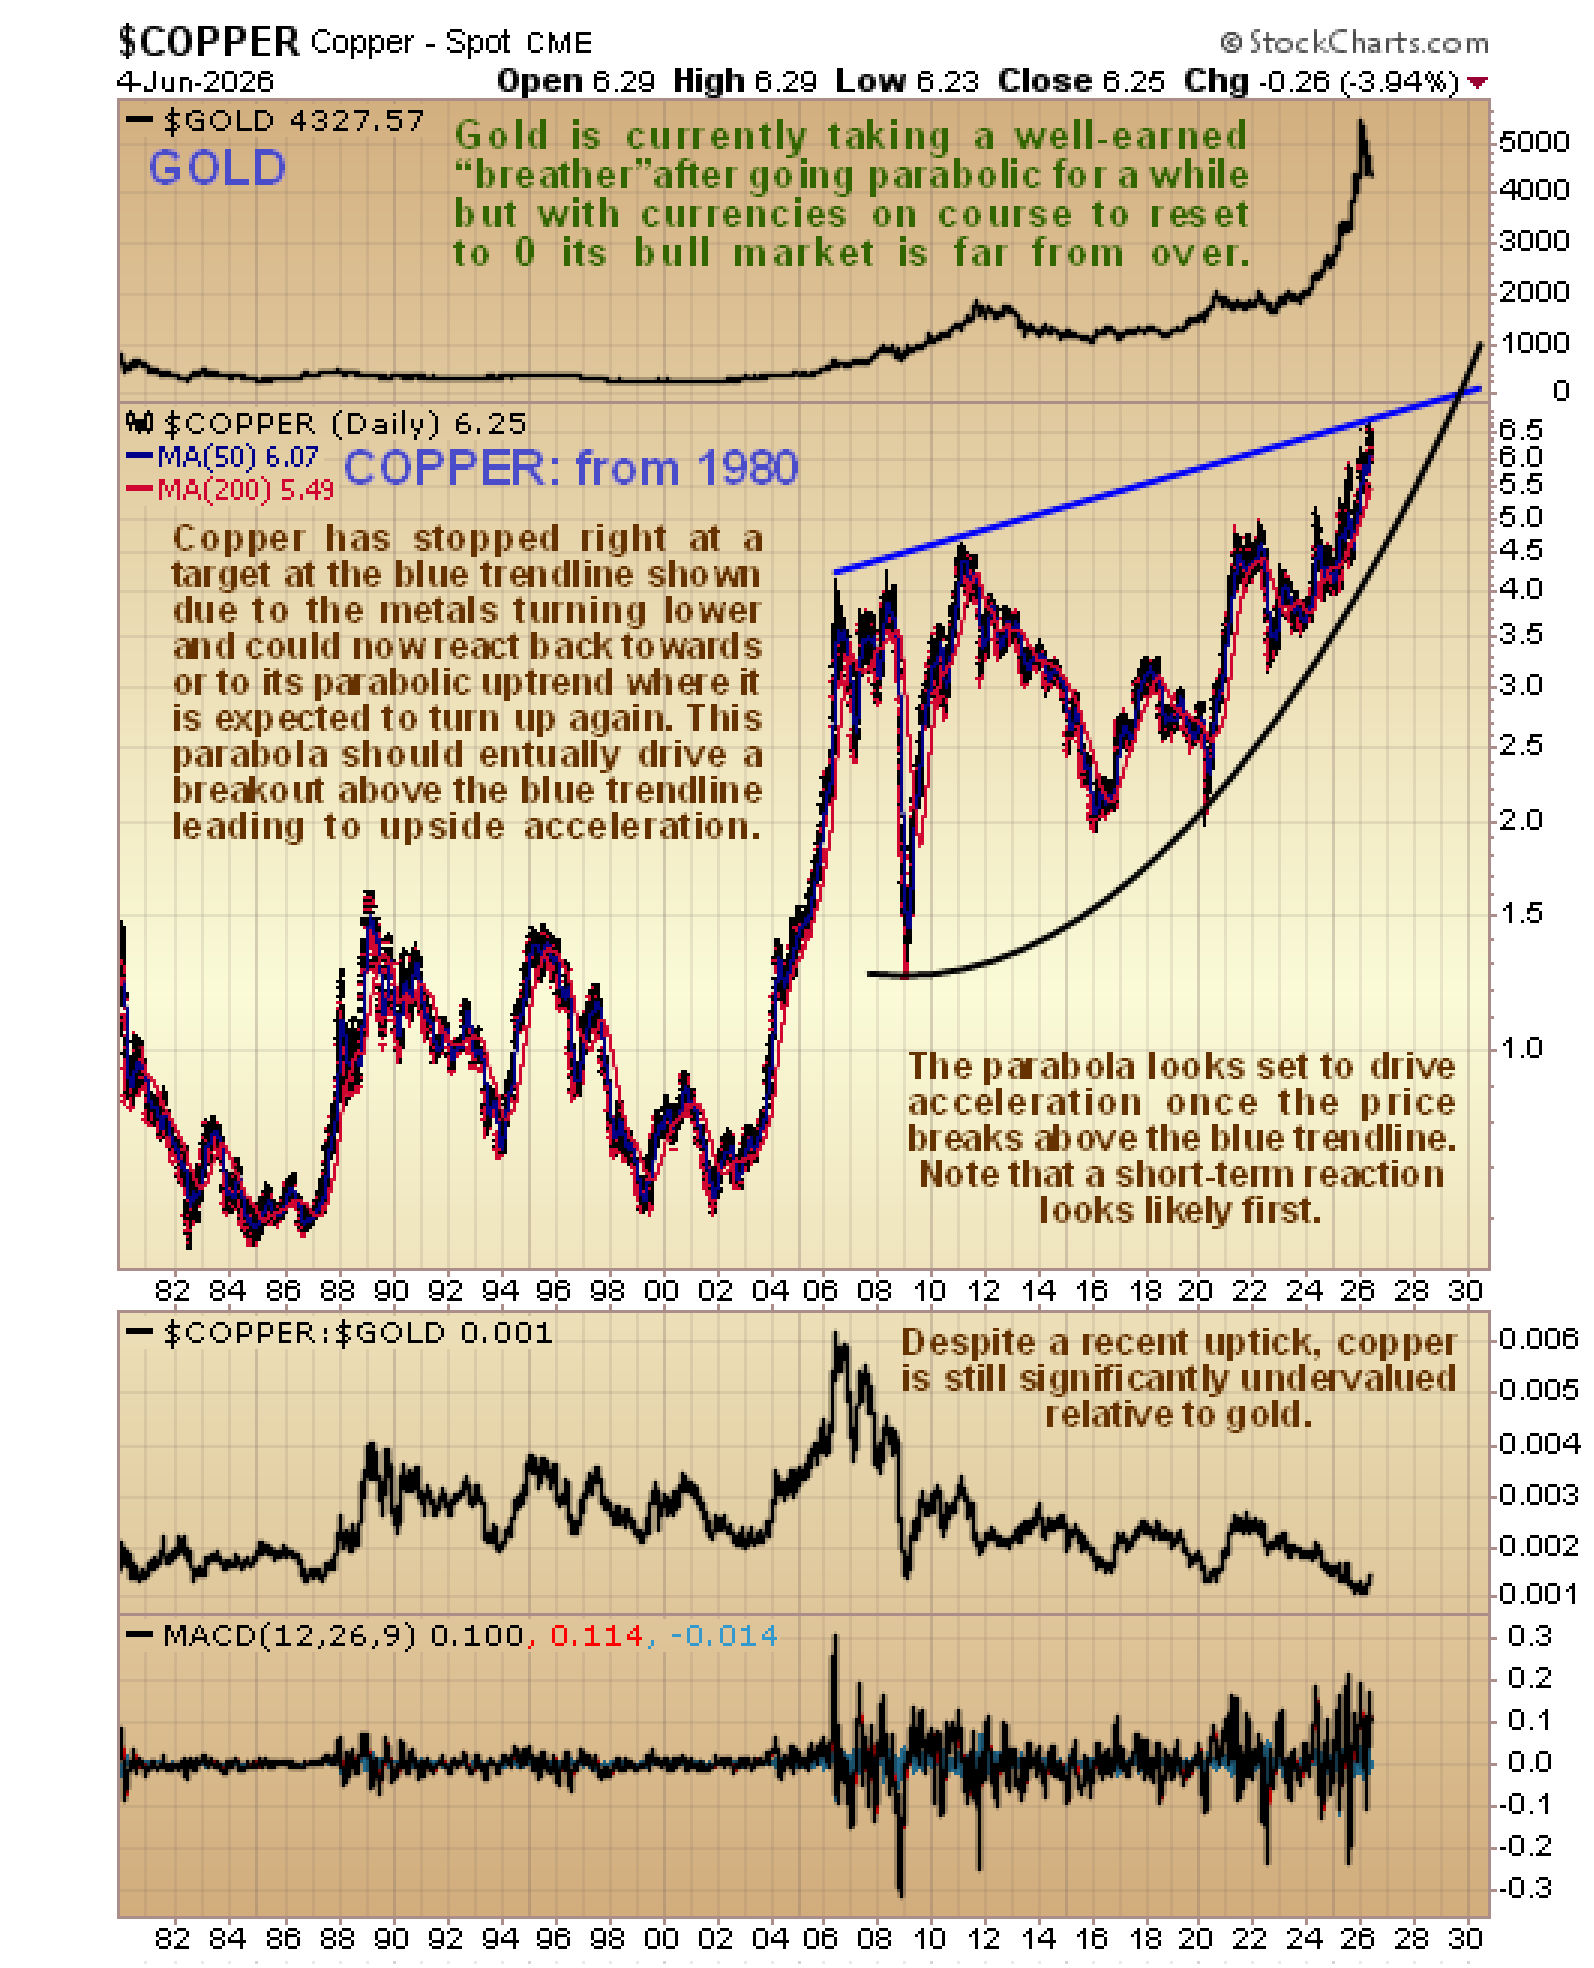
 Copper’s long-term chart from 1980 is most encouraging, for although we can see that it is currently being subjected to some constraint from the upsloping blue trendline shown, which just led to its reacting back, we can also see that the parabolic uptrend (if it holds, and it is expected to) is shepherding it towards a breakout above this line that should lead to a dramatic acceleration in its rate of advance – hardly surprising given the exceptionally positive long-term outlook for gold and silver…
 See also the YouTube video based on this article entitled Gold & Silver Downside Targets following serious break lower and US Dollar and Treasuries Outlook that was posted on Monday, 8th.


